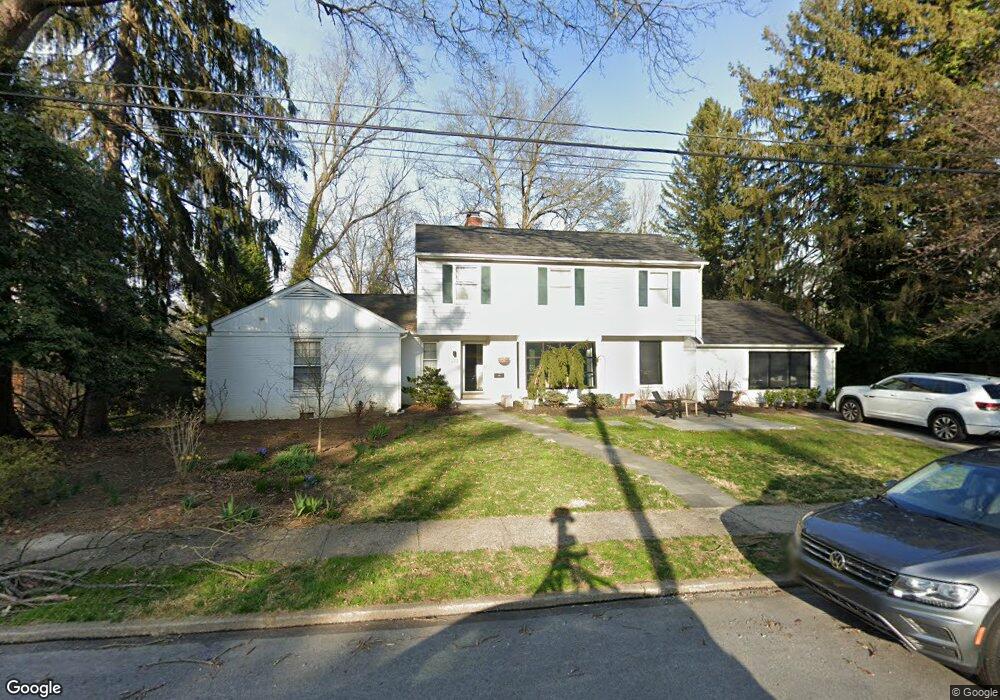
323 N Broad St Kennett Square, PA 19348
Estimated Value: $644,652 - $817,000
3
Beds
3
Baths
3,236
Sq Ft
$224/Sq Ft
Est. Value
About This Home
This home is located at 323 N Broad St, Kennett Square, PA 19348 and is currently estimated at $724,913, approximately $224 per square foot. 323 N Broad St is a home located in Chester County with nearby schools including Kennett Middle School, Kennett High School, and St. Patrick School.
Ownership History
Date
Name
Owned For
Owner Type
Purchase Details
Closed on
Mar 6, 2009
Sold by
Davis Tamara R
Bought by
Housh Cybil Yvette and Myers Evan Foster
Current Estimated Value
Home Financials for this Owner
Home Financials are based on the most recent Mortgage that was taken out on this home.
Original Mortgage
$330,000
Outstanding Balance
$209,946
Interest Rate
5.14%
Mortgage Type
Purchase Money Mortgage
Estimated Equity
$514,967
Purchase Details
Closed on
Jul 13, 2007
Sold by
Davis Angus K and Davis Tamara R
Bought by
Davis Tamara R
Purchase Details
Closed on
Sep 8, 1997
Sold by
Summers Timothy R and Summers Marilyn P
Bought by
Davis Angus K and Davis Tamara R
Home Financials for this Owner
Home Financials are based on the most recent Mortgage that was taken out on this home.
Original Mortgage
$138,400
Interest Rate
6.92%
Create a Home Valuation Report for This Property
The Home Valuation Report is an in-depth analysis detailing your home's value as well as a comparison with similar homes in the area
Home Values in the Area
Average Home Value in this Area
Purchase History
| Date | Buyer | Sale Price | Title Company |
|---|---|---|---|
| Housh Cybil Yvette | $350,000 | None Available | |
| Davis Tamara R | -- | None Available | |
| Davis Angus K | $173,000 | -- |
Source: Public Records
Mortgage History
| Date | Status | Borrower | Loan Amount |
|---|---|---|---|
| Open | Housh Cybil Yvette | $330,000 | |
| Previous Owner | Davis Angus K | $138,400 |
Source: Public Records
Tax History
| Year | Tax Paid | Tax Assessment Tax Assessment Total Assessment is a certain percentage of the fair market value that is determined by local assessors to be the total taxable value of land and additions on the property. | Land | Improvement |
|---|---|---|---|---|
| 2025 | $8,496 | $174,360 | $35,610 | $138,750 |
| 2024 | $8,496 | $174,360 | $35,610 | $138,750 |
| 2023 | $8,236 | $174,360 | $35,610 | $138,750 |
| 2022 | $7,469 | $173,000 | $35,610 | $137,390 |
| 2021 | $7,402 | $173,000 | $35,610 | $137,390 |
| 2020 | $7,278 | $173,000 | $35,610 | $137,390 |
| 2019 | $7,191 | $173,000 | $35,610 | $137,390 |
| 2018 | $7,023 | $173,000 | $35,610 | $137,390 |
| 2017 | $6,913 | $173,000 | $35,610 | $137,390 |
| 2016 | $686 | $173,000 | $35,610 | $137,390 |
| 2015 | $686 | $173,000 | $35,610 | $137,390 |
| 2014 | $686 | $173,000 | $35,610 | $137,390 |
Source: Public Records
Map
Nearby Homes
- 311 E State St
- 107 W State St
- 118 Austin Dr
- 126 Austin Dr
- 530 Richards Rd
- 535 Kenview Ave
- 602 D St
- 10102 Austin Dr
- 10101 Austin Dr
- 10102 Bramble St
- 10101 Bramble St
- 621 Magnolia Ct
- 631 Magnolia Ct
- 607 W Mulberry St
- 619 W Mulberry St
- 511 Louie Ln
- 10101 Louie Ln
- 527 Louie Ln
- 10102 Louie Ln
- 10104 Louie Ln
- 327 N Broad St
- 305 N Broad St
- 302 N Broad St
- 141 E Sickle St
- 310 N Broad St
- 333 N Broad St
- 306 N Broad St
- 107 E Sickle St
- 335 N Broad St
- 265 N Broad St
- 105 E Sickle St
- 316 N Broad St
- 337 N Broad St
- 257 N Broad St
- 108 E Sickle St
- 275 N Broad St
- 103 E Sickle St
- 251 N Broad St
- 391 N Broad St
- 104 E Sickle St
Your Personal Tour Guide
Ask me questions while you tour the home.