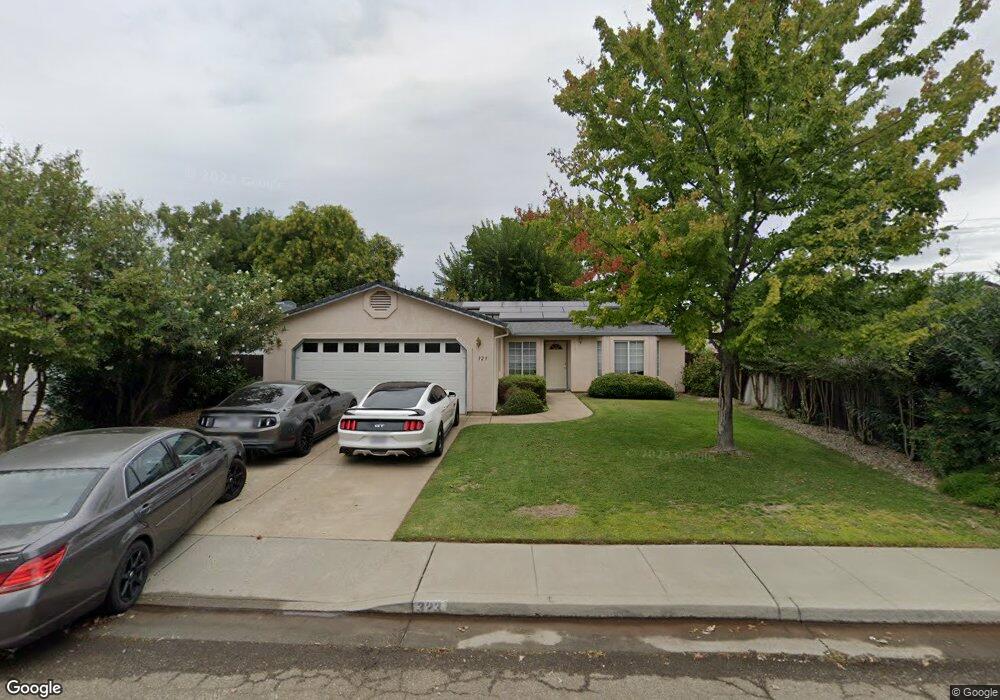
323 Pinon Way Red Bluff, CA 96080
Estimated Value: $304,000 - $368,000
3
Beds
2
Baths
1,348
Sq Ft
$247/Sq Ft
Est. Value
About This Home
This home is located at 323 Pinon Way, Red Bluff, CA 96080 and is currently estimated at $333,078, approximately $247 per square foot. 323 Pinon Way is a home located in Tehama County with nearby schools including Jackson Heights Elementary School, Vista Preparatory Academy, and Red Bluff High School.
Ownership History
Date
Name
Owned For
Owner Type
Purchase Details
Closed on
May 26, 2023
Sold by
Vanderzanden Kenny
Bought by
Vanderzanden Kenny and Rose Leslie Ann
Current Estimated Value
Purchase Details
Closed on
Mar 3, 2023
Sold by
Rose Leslie Ann
Bought by
Vanderzanden Kenny
Home Financials for this Owner
Home Financials are based on the most recent Mortgage that was taken out on this home.
Original Mortgage
$301,000
Interest Rate
6.65%
Purchase Details
Closed on
Jul 15, 2020
Sold by
Orange Deborah J and The Deborah Orange Living Trus
Bought by
Mcdaniel Dalbert Lynn and Mcdaniel Suzanne Lynn
Home Financials for this Owner
Home Financials are based on the most recent Mortgage that was taken out on this home.
Original Mortgage
$252,424
Interest Rate
3.1%
Mortgage Type
New Conventional
Create a Home Valuation Report for This Property
The Home Valuation Report is an in-depth analysis detailing your home's value as well as a comparison with similar homes in the area
Home Values in the Area
Average Home Value in this Area
Purchase History
| Date | Buyer | Sale Price | Title Company |
|---|---|---|---|
| Vanderzanden Kenny | -- | None Listed On Document | |
| Vanderzanden Kenny | -- | Placer Title | |
| Vanderzanden Kenny | $303,500 | Placer Title | |
| Mcdaniel Dalbert Lynn | $250,000 | Placer Title Company |
Source: Public Records
Mortgage History
| Date | Status | Borrower | Loan Amount |
|---|---|---|---|
| Previous Owner | Vanderzanden Kenny | $301,000 | |
| Previous Owner | Mcdaniel Dalbert Lynn | $252,424 |
Source: Public Records
Tax History Compared to Growth
Tax History
| Year | Tax Paid | Tax Assessment Tax Assessment Total Assessment is a certain percentage of the fair market value that is determined by local assessors to be the total taxable value of land and additions on the property. | Land | Improvement |
|---|---|---|---|---|
| 2025 | $3,134 | $315,761 | $67,626 | $248,135 |
| 2023 | $2,703 | $260,100 | $52,020 | $208,080 |
| 2022 | $2,685 | $255,000 | $51,000 | $204,000 |
| 2021 | $2,577 | $250,000 | $50,000 | $200,000 |
| 2020 | $1,627 | $159,812 | $35,827 | $123,985 |
| 2019 | $1,636 | $156,679 | $35,125 | $121,554 |
| 2018 | $1,512 | $153,608 | $34,437 | $119,171 |
| 2017 | $1,524 | $150,597 | $33,762 | $116,835 |
| 2016 | $1,422 | $147,645 | $33,100 | $114,545 |
| 2015 | $1,399 | $145,428 | $32,603 | $112,825 |
| 2014 | $1,377 | $142,580 | $31,965 | $110,615 |
Source: Public Records
Map
Nearby Homes