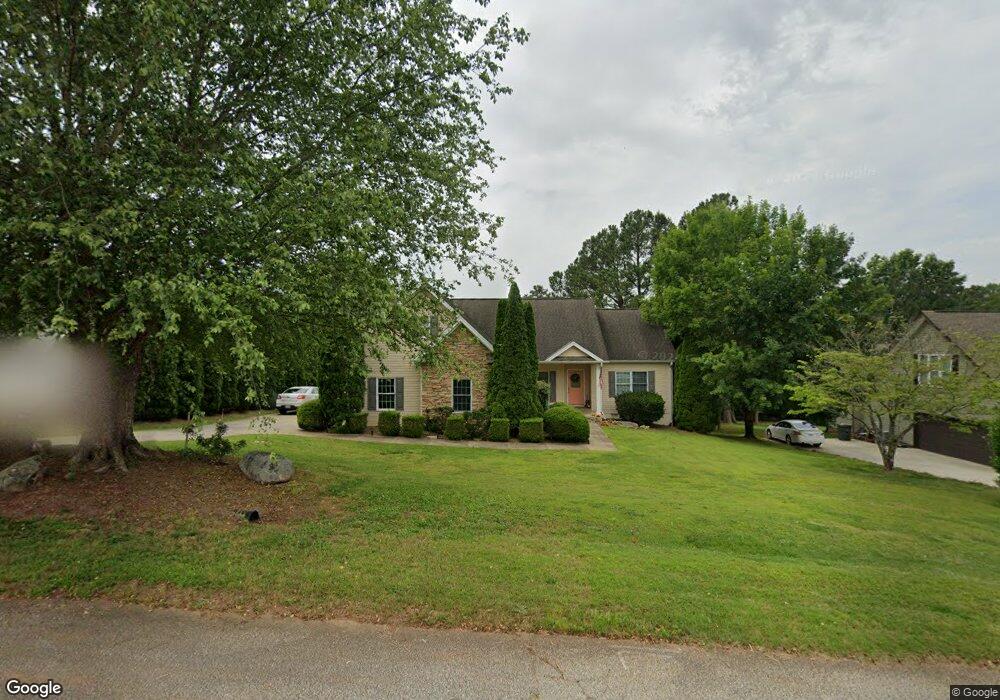
323 Ravens View Dr Unit PROVIDENCE RIDGE Seneca, SC 29678
Estimated Value: $388,890 - $449,000
3
Beds
2
Baths
1,948
Sq Ft
$208/Sq Ft
Est. Value
About This Home
This home is located at 323 Ravens View Dr Unit PROVIDENCE RIDGE, Seneca, SC 29678 and is currently estimated at $405,473, approximately $208 per square foot. 323 Ravens View Dr Unit PROVIDENCE RIDGE is a home located in Oconee County with nearby schools including Ravenel Elementary School, Seneca Middle School, and Seneca High School.
Ownership History
Date
Name
Owned For
Owner Type
Purchase Details
Closed on
Feb 22, 2024
Sold by
Barone Glenn S and Barone Kathleen L
Bought by
Glenn S And Kathleen L Barone Family Trust and Barone
Current Estimated Value
Purchase Details
Closed on
Nov 18, 2021
Sold by
Reel Properties Group Corp
Bought by
Barone Glenn S and Barone Kathleen L
Home Financials for this Owner
Home Financials are based on the most recent Mortgage that was taken out on this home.
Original Mortgage
$255,000
Interest Rate
3.09%
Mortgage Type
New Conventional
Purchase Details
Closed on
Apr 2, 2021
Sold by
Bratton Heidi L
Bought by
Bratton Jack C and Bratton Heidi L
Home Financials for this Owner
Home Financials are based on the most recent Mortgage that was taken out on this home.
Original Mortgage
$187,500
Interest Rate
2.9%
Mortgage Type
Construction
Create a Home Valuation Report for This Property
The Home Valuation Report is an in-depth analysis detailing your home's value as well as a comparison with similar homes in the area
Home Values in the Area
Average Home Value in this Area
Purchase History
| Date | Buyer | Sale Price | Title Company |
|---|---|---|---|
| Glenn S And Kathleen L Barone Family Trust | -- | None Listed On Document | |
| Barone Glenn S | $340,000 | None Available | |
| Bratton Jack C | $212,000 | None Available |
Source: Public Records
Mortgage History
| Date | Status | Borrower | Loan Amount |
|---|---|---|---|
| Previous Owner | Barone Glenn S | $255,000 | |
| Previous Owner | Bratton Jack C | $187,500 |
Source: Public Records
Tax History Compared to Growth
Tax History
| Year | Tax Paid | Tax Assessment Tax Assessment Total Assessment is a certain percentage of the fair market value that is determined by local assessors to be the total taxable value of land and additions on the property. | Land | Improvement |
|---|---|---|---|---|
| 2024 | $1,928 | $13,231 | $688 | $12,543 |
| 2023 | $2,198 | $13,231 | $688 | $12,543 |
| 2022 | $5,537 | $13,295 | $688 | $12,607 |
| 2021 | $872 | $8,044 | $1,068 | $6,976 |
| 2020 | $872 | $8,044 | $1,068 | $6,976 |
| 2019 | $872 | $0 | $0 | $0 |
| 2018 | $1,761 | $0 | $0 | $0 |
| 2017 | $1,194 | $0 | $0 | $0 |
| 2016 | $1,194 | $0 | $0 | $0 |
| 2015 | -- | $0 | $0 | $0 |
| 2014 | -- | $7,402 | $948 | $6,454 |
| 2013 | -- | $0 | $0 | $0 |
Source: Public Records
Map
Nearby Homes
- 105 Scott Dr
- 305 Creek Dr
- 726 Bellview Way
- 116 Straight Arrow Way
- 503 Oakmont Valley Trail
- 307 Willow Brook Ln
- 409 Oakmont Valley Trail
- 000 N Stribling St
- 0 N Stribling St
- 401 Oakmont Valley Trail
- 304 Oakmont Valley Trail
- 10149 and 10161 Clemson Blvd Unit 3.94 acres
- 28.32 Acres Clemson Blvd Unit With Sewer
- 1208 E Main St
- 710 Evelyn Dr
- 704 W Grady St
- 303 Hunter St
- 905 E South 2nd St
- 307 Hunter St
- 106 Laurel Ln
- 323 Ravens View Dr
- 321 Ravens View Dr
- 325 Ravens View Dr
- Lot 46 Ravins View Dr
- 327 Ravens View Dr
- 327 Ravens View Dr Unit PROVIDENCE RIDGE
- 319 Ravens View Dr
- 322 Ravens View Dr
- 326 Ravens View Dr
- 317 Ravens View Dr
- 324 Ravens View Dr
- 324 Ravens View Dr Unit PROVIDENCE RIDGE
- 329 Ravens View Dr
- 320 Ravens View Dr
- 315 Ravens View Dr
- 318 Ravens View Dr
- 328 Raven's View Dr
- 328 Ravens View Dr
- 316 Ravens View Dr
- 331 Ravens View Dr