Estimated Value: $166,000 - $256,000
2
Beds
2
Baths
1,672
Sq Ft
$135/Sq Ft
Est. Value
About This Home
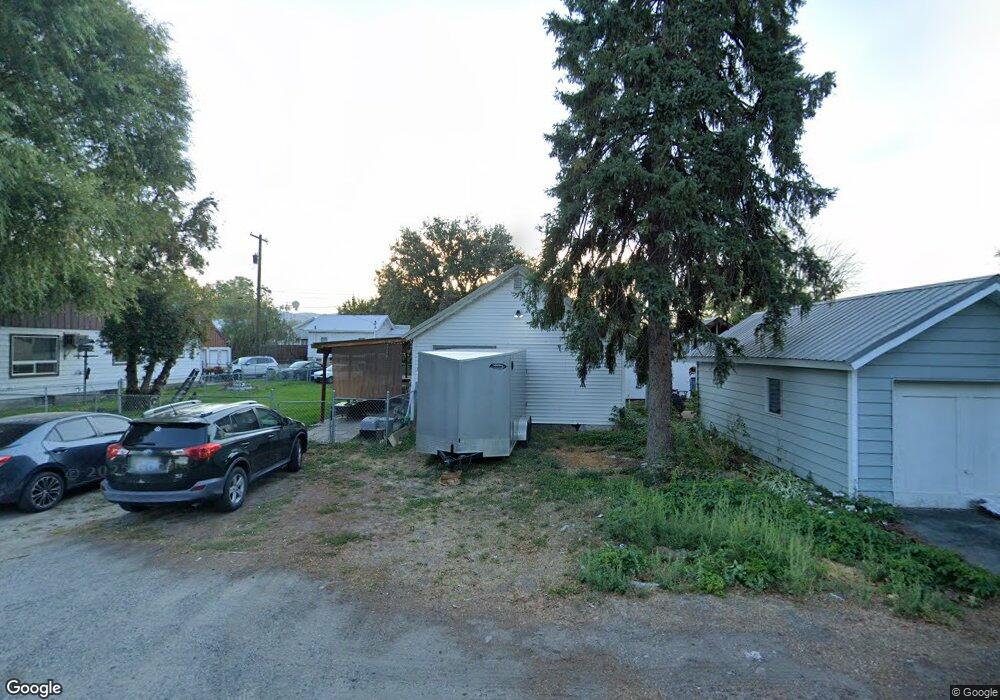
This home is located at 323 S Cedar St, Omak, WA 98841 and is currently estimated at $225,234, approximately $134 per square foot. 323 S Cedar St is a home located in Okanogan County with nearby schools including North Omak Elementary School, East Omak Elementary School, and Omak Middle School.
Ownership History
Date
Name
Owned For
Owner Type
Purchase Details
Closed on
Aug 27, 2008
Sold by
Silva Jose A and Silva Brandy
Bought by
Kruger Shelley
Current Estimated Value
Home Financials for this Owner
Home Financials are based on the most recent Mortgage that was taken out on this home.
Original Mortgage
$104,500
Outstanding Balance
$68,670
Interest Rate
6.27%
Mortgage Type
Future Advance Clause Open End Mortgage
Estimated Equity
$156,564
Purchase Details
Closed on
Nov 15, 2006
Sold by
Gage Betty M
Bought by
Silva Jose A and Silva Brandy
Home Financials for this Owner
Home Financials are based on the most recent Mortgage that was taken out on this home.
Original Mortgage
$77,000
Interest Rate
6.28%
Mortgage Type
New Conventional
Create a Home Valuation Report for This Property
The Home Valuation Report is an in-depth analysis detailing your home's value as well as a comparison with similar homes in the area
Home Values in the Area
Average Home Value in this Area
Purchase History
| Date | Buyer | Sale Price | Title Company |
|---|---|---|---|
| Kruger Shelley | $110,000 | Baines Title Co | |
| Silva Jose A | $77,000 | Baines Title Co |
Source: Public Records
Mortgage History
| Date | Status | Borrower | Loan Amount |
|---|---|---|---|
| Open | Kruger Shelley | $104,500 | |
| Previous Owner | Silva Jose A | $77,000 |
Source: Public Records
Tax History Compared to Growth
Tax History
| Year | Tax Paid | Tax Assessment Tax Assessment Total Assessment is a certain percentage of the fair market value that is determined by local assessors to be the total taxable value of land and additions on the property. | Land | Improvement |
|---|---|---|---|---|
| 2025 | -- | $178,100 | $16,200 | $161,900 |
| 2024 | $1,381 | $162,900 | $16,200 | $146,700 |
| 2022 | $1,265 | $117,400 | $16,200 | $101,200 |
| 2021 | $1,048 | $117,400 | $16,200 | $101,200 |
| 2020 | $1,023 | $89,600 | $13,200 | $76,400 |
| 2019 | $1,014 | $89,600 | $13,200 | $76,400 |
| 2018 | $1,059 | $78,500 | $13,200 | $65,300 |
| 2017 | $964 | $78,500 | $13,200 | $65,300 |
| 2016 | $949 | $78,500 | $13,200 | $65,300 |
| 2015 | $892 | $77,000 | $13,200 | $63,800 |
| 2013 | -- | $77,000 | $13,200 | $63,800 |
Source: Public Records
Map
Nearby Homes
- 313 Birch St S
- 309 S Birch St
- 416 S Cedar St
- 304 S Main St
- 423 3rd Ave W
- 430 W 4th Ave
- 211 S Granite St
- 107 N Cedar St
- 28 Fir St N
- 18 Cherry Ave W
- 14 Dalton Rd
- 0 TBD E Ridge Dr
- 12 Dewberry Ave W
- 522 Ironwood St
- 725 Okoma Dr
- 14 Hahn Rd
- 519 Locust St
- 367 Fig Ave E
- 6 Valley View Park Dr
- 1 Lot (Powers Sp) Duck Lake Rd