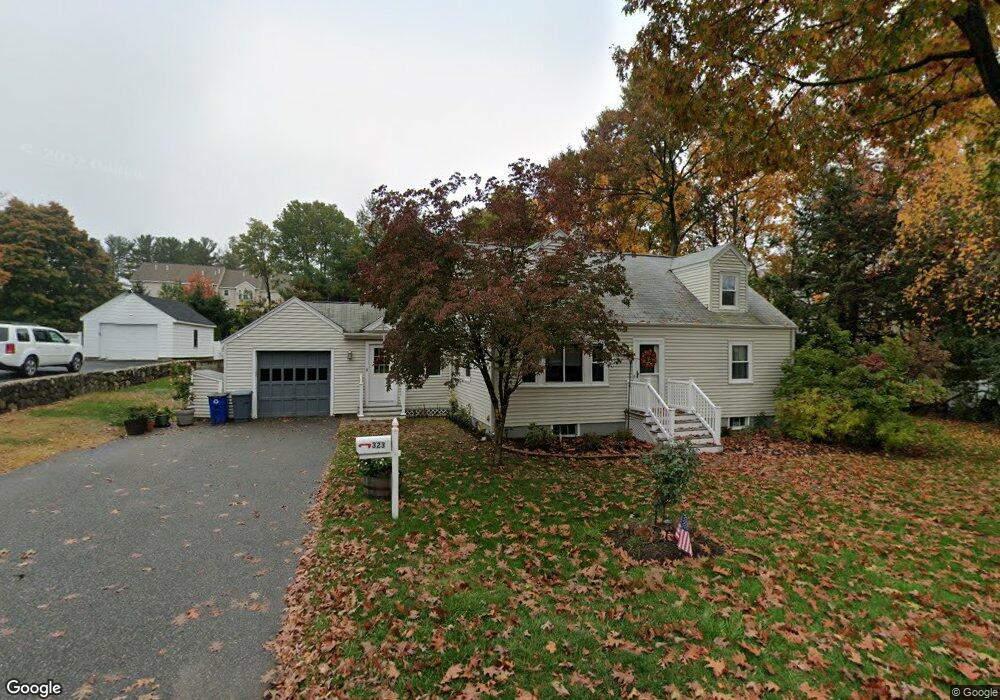
323 South St Reading, MA 01867
Estimated Value: $768,000 - $912,000
2
Beds
2
Baths
999,999
Sq Ft
$1/Sq Ft
Est. Value
About This Home
This home is located at 323 South St, Reading, MA 01867 and is currently estimated at $823,865, approximately $0 per square foot. 323 South St is a home located in Middlesex County with nearby schools including Joshua Eaton Elementary School, Walter S. Parker Middle School, and Reading Memorial High School.
Ownership History
Date
Name
Owned For
Owner Type
Purchase Details
Closed on
Jul 13, 2001
Sold by
Snow David W and Snow Layne C
Bought by
Spinney Scott R and Spinney Sheila C
Current Estimated Value
Home Financials for this Owner
Home Financials are based on the most recent Mortgage that was taken out on this home.
Original Mortgage
$251,200
Interest Rate
7.2%
Mortgage Type
Purchase Money Mortgage
Purchase Details
Closed on
Sep 30, 1996
Sold by
Malynn Elizabeth R and Malynn Michael F
Bought by
Snow David S and Snow Layne C
Home Financials for this Owner
Home Financials are based on the most recent Mortgage that was taken out on this home.
Original Mortgage
$180,405
Interest Rate
7.83%
Mortgage Type
Purchase Money Mortgage
Purchase Details
Closed on
Jul 7, 1988
Sold by
Struge Mary A
Bought by
Malynn Elizabeth R
Create a Home Valuation Report for This Property
The Home Valuation Report is an in-depth analysis detailing your home's value as well as a comparison with similar homes in the area
Home Values in the Area
Average Home Value in this Area
Purchase History
| Date | Buyer | Sale Price | Title Company |
|---|---|---|---|
| Spinney Scott R | $314,900 | -- | |
| Snow David S | $189,900 | -- | |
| Malynn Elizabeth R | $177,500 | -- |
Source: Public Records
Mortgage History
| Date | Status | Borrower | Loan Amount |
|---|---|---|---|
| Open | Malynn Elizabeth R | $330,733 | |
| Closed | Malynn Elizabeth R | $251,200 | |
| Previous Owner | Malynn Elizabeth R | $180,405 |
Source: Public Records
Tax History Compared to Growth
Tax History
| Year | Tax Paid | Tax Assessment Tax Assessment Total Assessment is a certain percentage of the fair market value that is determined by local assessors to be the total taxable value of land and additions on the property. | Land | Improvement |
|---|---|---|---|---|
| 2025 | $9,039 | $793,600 | $531,400 | $262,200 |
| 2024 | $8,935 | $762,400 | $510,500 | $251,900 |
| 2023 | $8,658 | $687,700 | $460,300 | $227,400 |
| 2022 | $8,335 | $625,300 | $418,400 | $206,900 |
| 2021 | $13,152 | $589,600 | $400,900 | $188,700 |
| 2020 | $7,827 | $561,100 | $381,500 | $179,600 |
| 2019 | $7,607 | $534,600 | $363,400 | $171,200 |
| 2018 | $11,311 | $504,300 | $342,700 | $161,600 |
| 2017 | $6,730 | $504,300 | $342,700 | $161,600 |
| 2016 | $6,360 | $438,600 | $292,000 | $146,600 |
| 2015 | $6,142 | $417,800 | $278,100 | $139,700 |
| 2014 | $5,732 | $388,900 | $258,700 | $130,200 |
Source: Public Records
Map
Nearby Homes
- 313 South St
- 62 Abigail Way Unit 2007
- 62 Abigail Way Unit 3004
- 7 Leaning Elm Dr Unit 7
- 89 Walnut St
- 133 Pine Ridge Rd
- 246 Walnut St
- 13 Elaine Rd
- 2 Summit Dr Unit 18
- 97 Oak St
- 64 Main St Unit 41B
- 68 Main St Unit 36C
- 237 Main St Unit A4
- 75 Border Rd
- 114 Parker Rd
- 35 Park Ave
- 43 Friend St
- 4 Mcdonald Farm Rd
- 62 High St Unit 4
- 62 High St Unit 3
- 329 South St
- 317 South St
- 317 South St
- 333 South St
- 333 South St Unit 1
- 324 South St
- 328 South St
- 51 Jacob Way
- 337 South St
- 47 Jacob Way Unit 47
- 47 Jacob Way Unit 14
- 45 Jacob Way Unit 13
- 45 Jacob Way Unit 45
- 332 South St
- 318 South St
- 12 Haystack Rd
- 49 Jacob Way Unit 15
- 336 South St
- 7 Augustus Ct Unit 3008
- 7 Augustus Ct Unit 3005