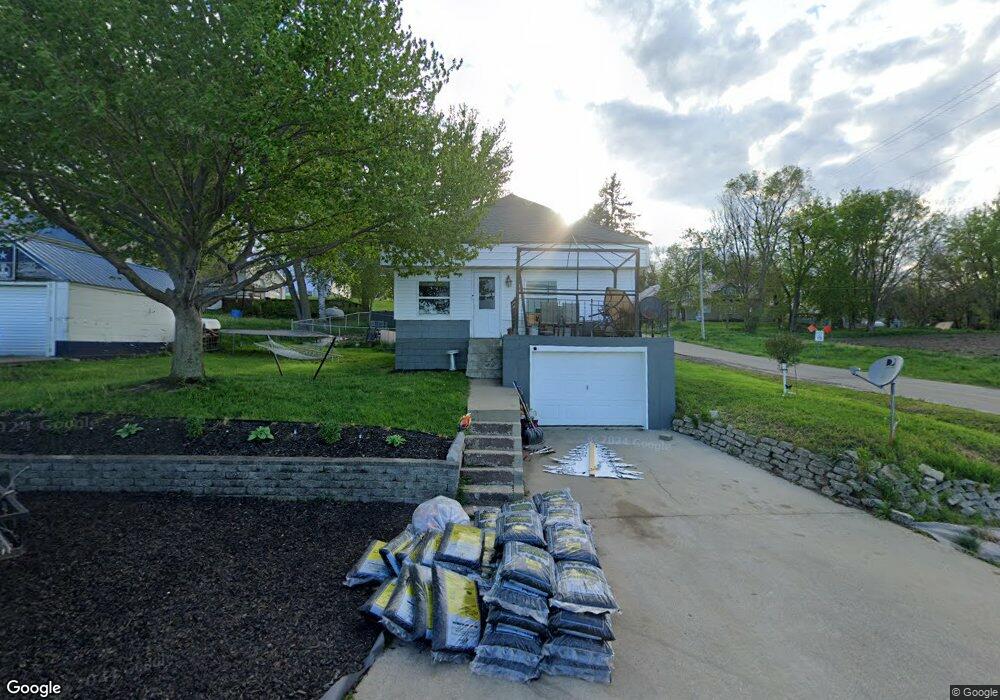
323 Summit St Pierson, IA 51048
Estimated Value: $58,558 - $100,000
2
Beds
2
Baths
960
Sq Ft
$79/Sq Ft
Est. Value
About This Home
This home is located at 323 Summit St, Pierson, IA 51048 and is currently estimated at $76,140, approximately $79 per square foot. 323 Summit St is a home located in Woodbury County with nearby schools including Pierson Elementary School, Pierson Middle School, and Kingsley-Pierson High School.
Ownership History
Date
Name
Owned For
Owner Type
Purchase Details
Closed on
Apr 21, 2023
Sold by
Bauer-Hanner Jaime
Bought by
Bauer-Hanner Jaime and Hanner Alex
Current Estimated Value
Purchase Details
Closed on
May 12, 2014
Sold by
Herbold Arlo D and Herbold Patricia A
Bought by
Chinn Ryan M and Chinn Jaime
Home Financials for this Owner
Home Financials are based on the most recent Mortgage that was taken out on this home.
Original Mortgage
$20,250
Interest Rate
5.12%
Mortgage Type
Adjustable Rate Mortgage/ARM
Create a Home Valuation Report for This Property
The Home Valuation Report is an in-depth analysis detailing your home's value as well as a comparison with similar homes in the area
Home Values in the Area
Average Home Value in this Area
Purchase History
| Date | Buyer | Sale Price | Title Company |
|---|---|---|---|
| Bauer-Hanner Jaime | -- | None Listed On Document | |
| Chinn Ryan M | $22,500 | None Available |
Source: Public Records
Mortgage History
| Date | Status | Borrower | Loan Amount |
|---|---|---|---|
| Previous Owner | Chinn Ryan M | $20,250 |
Source: Public Records
Tax History Compared to Growth
Tax History
| Year | Tax Paid | Tax Assessment Tax Assessment Total Assessment is a certain percentage of the fair market value that is determined by local assessors to be the total taxable value of land and additions on the property. | Land | Improvement |
|---|---|---|---|---|
| 2025 | $520 | $37,640 | $4,150 | $33,490 |
| 2024 | $520 | $39,580 | $4,150 | $35,430 |
| 2023 | $446 | $39,580 | $4,150 | $35,430 |
| 2022 | $438 | $30,000 | $4,150 | $25,850 |
| 2021 | $438 | $30,000 | $4,150 | $25,850 |
| 2020 | $408 | $27,850 | $4,440 | $23,410 |
| 2019 | $390 | $27,850 | $4,440 | $23,410 |
| 2018 | $398 | $26,180 | $4,440 | $21,740 |
| 2017 | $410 | $26,180 | $4,440 | $21,740 |
| 2016 | $402 | $26,180 | $0 | $0 |
| 2015 | $402 | $24,470 | $4,150 | $20,320 |
| 2014 | $557 | $24,470 | $4,150 | $20,320 |
Source: Public Records
Map
Nearby Homes