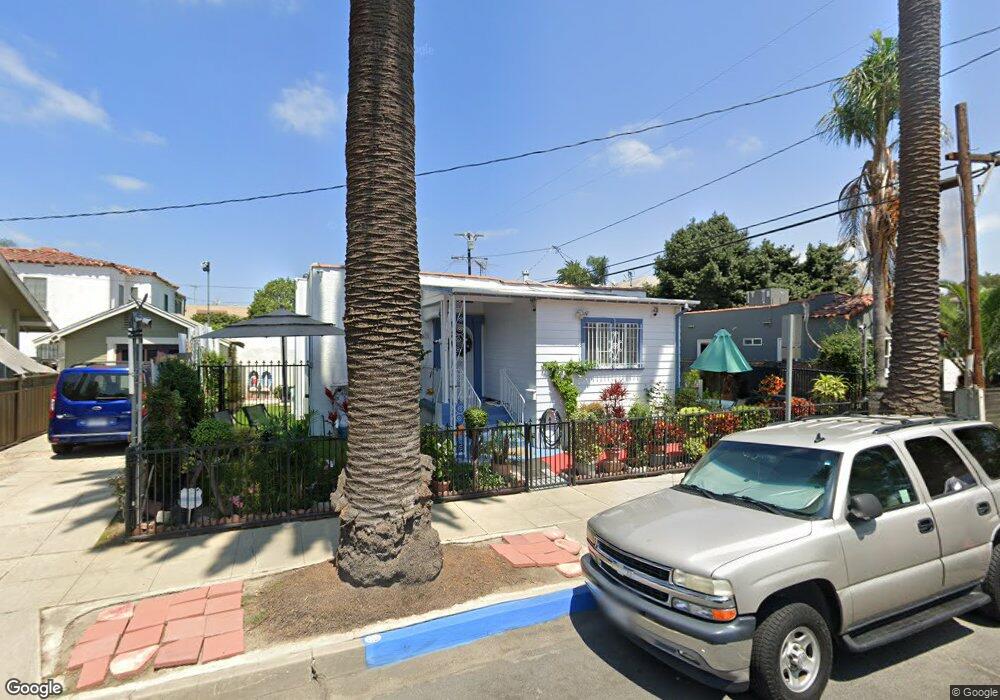
323 W 23rd St Long Beach, CA 90806
South Wrigley NeighborhoodEstimated Value: $651,964 - $786,000
2
Beds
1
Bath
996
Sq Ft
$714/Sq Ft
Est. Value
About This Home
This home is located at 323 W 23rd St, Long Beach, CA 90806 and is currently estimated at $710,991, approximately $713 per square foot. 323 W 23rd St is a home located in Los Angeles County with nearby schools including Lafayette Elementary School, Washington Middle School, and Juan Rodriguez Cabrillo High School.
Ownership History
Date
Name
Owned For
Owner Type
Purchase Details
Closed on
Oct 18, 2008
Sold by
Martin Peter J and Martin Melinda E
Bought by
Martin Peter J
Current Estimated Value
Purchase Details
Closed on
Feb 26, 2008
Sold by
Martin Peter J and Martin Melinda E
Bought by
Martin Peter J
Purchase Details
Closed on
Jul 30, 2005
Sold by
Martin Peter J and Martin Melinda E
Bought by
Martin Peter J
Purchase Details
Closed on
Jan 15, 1996
Sold by
Emc Mtg Corp
Bought by
Martin Peter J and Martin Melinda E
Home Financials for this Owner
Home Financials are based on the most recent Mortgage that was taken out on this home.
Original Mortgage
$90,000
Outstanding Balance
$2,370
Interest Rate
7.04%
Mortgage Type
VA
Estimated Equity
$708,621
Purchase Details
Closed on
Apr 21, 1995
Sold by
Areias Arthur J and Great Western Bank Fsb
Bought by
Great Western Bank Fsb
Purchase Details
Closed on
Mar 22, 1994
Sold by
Areias Arthur J
Bought by
Martin John L
Create a Home Valuation Report for This Property
The Home Valuation Report is an in-depth analysis detailing your home's value as well as a comparison with similar homes in the area
Home Values in the Area
Average Home Value in this Area
Purchase History
We collect this data history from publicly available records. To have your information removed, we recommend requesting removal directly through your county’s website.
| Date | Buyer | Sale Price | Title Company |
|---|---|---|---|
| Martin Peter J | -- | None Available | |
| Martin Peter J | -- | None Available | |
| Martin Peter J | -- | -- | |
| Martin Peter J | $90,000 | Chicago Title Co | |
| Great Western Bank Fsb | $104,789 | Chicago Title Company | |
| Martin John L | -- | -- |
Source: Public Records
Mortgage History
We collect this data history from publicly available records. To have your information removed, we recommend requesting removal directly through your county’s website.
| Date | Status | Borrower | Loan Amount |
|---|---|---|---|
| Open | Martin Peter J | $90,000 |
Source: Public Records
Tax History
| Year | Tax Paid | Tax Assessment Tax Assessment Total Assessment is a certain percentage of the fair market value that is determined by local assessors to be the total taxable value of land and additions on the property. | Land | Improvement |
|---|---|---|---|---|
| 2025 | $2,175 | $149,485 | $94,182 | $55,303 |
| 2024 | $2,075 | $146,555 | $92,336 | $54,219 |
| 2023 | $2,036 | $143,682 | $90,526 | $53,156 |
| 2022 | $1,917 | $140,865 | $88,751 | $52,114 |
| 2021 | $1,870 | $138,104 | $87,011 | $51,093 |
| 2019 | $1,841 | $134,010 | $84,431 | $49,579 |
| 2018 | $1,757 | $131,383 | $82,776 | $48,607 |
| 2016 | $1,613 | $126,282 | $79,562 | $46,720 |
| 2015 | $1,552 | $124,386 | $78,367 | $46,019 |
| 2014 | $1,546 | $121,950 | $76,832 | $45,118 |
Source: Public Records
Map
Nearby Homes
- 2240 Eucalyptus Ave
- 2175 Chestnut Ave
- 2444 Pacific Ave
- 201 E Eagle St
- 2320 Locust Ave
- 223 E Eagle St
- 2337 Long Beach Blvd
- 2129 Locust Ave
- 2459 Maine Ave
- 2553 Pine Ave
- 2030 Eucalyptus Ave
- 2045 Pine Ave
- 2000 Pacific Ave
- 2170 Golden Ave
- 1950 Magnolia Ave
- 1958 Pine Ave
- 2430 San Francisco Ave
- 1952 Pine Ave
- 2048 Golden Ave
- 410 E 21st St
- 2310 Chestnut Ave
- 2302 Chestnut Ave
- 2316 Chestnut Ave
- 2309 Cedar Ave
- 2309 Cedar Ave Unit 5
- 2290 Chestnut Ave
- 2317 Cedar Ave
- 2301 Cedar Ave
- 2295 Cedar Ave
- 2324 Chestnut Ave
- 2280 Chestnut Ave Unit Pool House
- 2280 Chestnut Ave
- 2285 Cedar Ave
- 2332 Chestnut Ave
- 2301 Chestnut Ave
- 2309 Chestnut Ave
- 2272 Chestnut Ave
- 2275 Cedar Ave
- 2275 Cerdar Ave
- 400 W 23rd St
Your Personal Tour Guide
Ask me questions while you tour the home.