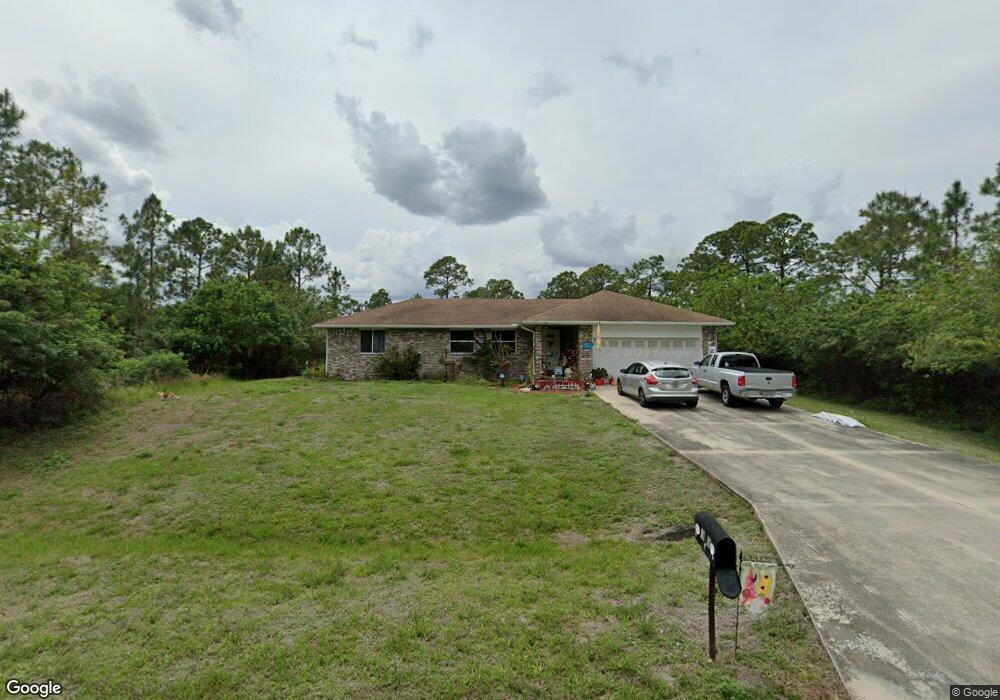
323 Wells Ave Lehigh Acres, FL 33936
Joel NeighborhoodEstimated Value: $258,024 - $299,000
3
Beds
2
Baths
1,311
Sq Ft
$210/Sq Ft
Est. Value
About This Home
This home is located at 323 Wells Ave, Lehigh Acres, FL 33936 and is currently estimated at $275,006, approximately $209 per square foot. 323 Wells Ave is a home located in Lee County with nearby schools including Lehigh Elementary School, The Alva School, and Gateway Elementary School.
Ownership History
Date
Name
Owned For
Owner Type
Purchase Details
Closed on
Jul 29, 2023
Sold by
Molnar Mary Ellen
Bought by
Molnar Mary Ellen and Molnar Alexis
Current Estimated Value
Home Financials for this Owner
Home Financials are based on the most recent Mortgage that was taken out on this home.
Original Mortgage
$247,920
Outstanding Balance
$241,873
Interest Rate
6.67%
Mortgage Type
VA
Estimated Equity
$33,133
Purchase Details
Closed on
Nov 24, 2003
Sold by
White Don M
Bought by
Molnar Mary Ellen
Purchase Details
Closed on
Jan 23, 2003
Sold by
Yelvington Frank L and Yelvington Carol Jh
Bought by
White Don M
Create a Home Valuation Report for This Property
The Home Valuation Report is an in-depth analysis detailing your home's value as well as a comparison with similar homes in the area
Home Values in the Area
Average Home Value in this Area
Purchase History
| Date | Buyer | Sale Price | Title Company |
|---|---|---|---|
| Molnar Mary Ellen | $100 | Mortgage Connect | |
| Molnar Mary Ellen | $126,500 | -- | |
| White Don M | $3,000 | -- |
Source: Public Records
Mortgage History
| Date | Status | Borrower | Loan Amount |
|---|---|---|---|
| Open | Molnar Mary Ellen | $247,920 |
Source: Public Records
Tax History Compared to Growth
Tax History
| Year | Tax Paid | Tax Assessment Tax Assessment Total Assessment is a certain percentage of the fair market value that is determined by local assessors to be the total taxable value of land and additions on the property. | Land | Improvement |
|---|---|---|---|---|
| 2025 | $1,147 | $68,070 | -- | -- |
| 2024 | $1,147 | $66,152 | -- | -- |
| 2023 | $1,030 | $54,225 | $0 | $0 |
| 2022 | $1,044 | $61,354 | $0 | $0 |
| 2021 | $974 | $135,078 | $7,995 | $127,083 |
| 2020 | $968 | $59,702 | $0 | $0 |
| 2019 | $1,020 | $58,360 | $0 | $0 |
| 2018 | $992 | $57,272 | $0 | $0 |
| 2017 | $956 | $56,094 | $0 | $0 |
| 2016 | $924 | $89,509 | $5,891 | $83,618 |
| 2015 | $916 | $73,499 | $4,659 | $68,840 |
| 2014 | $768 | $71,996 | $4,417 | $67,579 |
| 2013 | -- | $60,800 | $3,851 | $56,949 |
Source: Public Records
Map
Nearby Homes