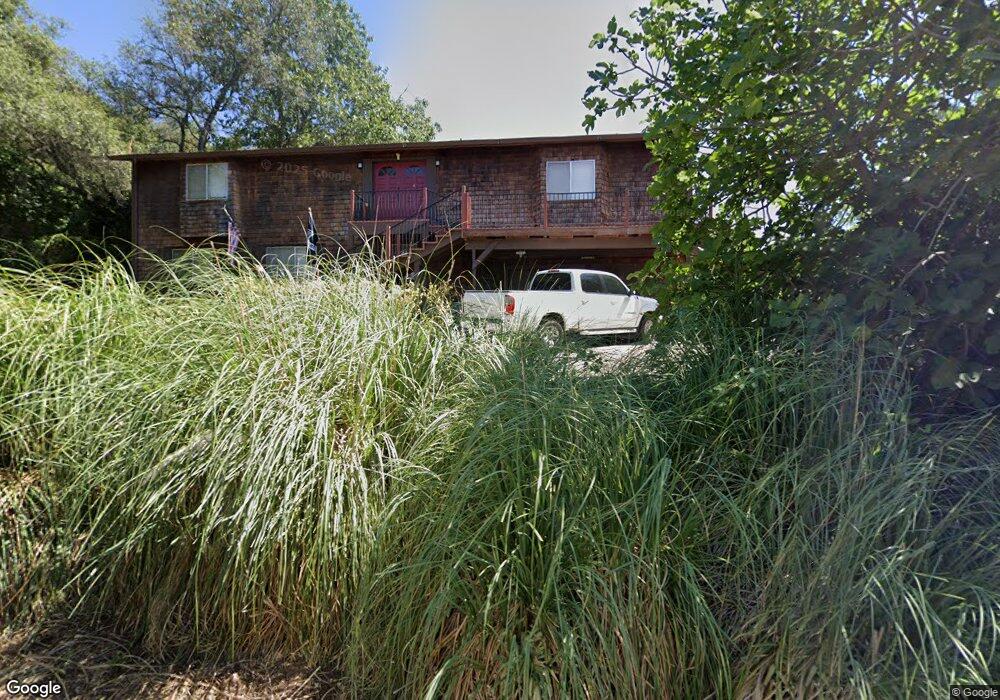
3230 Cessna Dr Cameron Park, CA 95682
Estimated Value: $618,823 - $741,000
3
Beds
2
Baths
2,342
Sq Ft
$297/Sq Ft
Est. Value
About This Home
This home is located at 3230 Cessna Dr, Cameron Park, CA 95682 and is currently estimated at $696,206, approximately $297 per square foot. 3230 Cessna Dr is a home located in El Dorado County with nearby schools including Rescue Elementary School, Pleasant Grove Middle School, and Ponderosa High School.
Ownership History
Date
Name
Owned For
Owner Type
Purchase Details
Closed on
Sep 16, 2010
Sold by
Manges Loren E
Bought by
Manges Loren E and Loren Manges Revocable Trust
Current Estimated Value
Purchase Details
Closed on
Aug 3, 2001
Sold by
Manges Loren Elmer
Bought by
Manges Loren E
Home Financials for this Owner
Home Financials are based on the most recent Mortgage that was taken out on this home.
Original Mortgage
$240,000
Outstanding Balance
$93,214
Interest Rate
7.09%
Mortgage Type
Credit Line Revolving
Estimated Equity
$602,992
Purchase Details
Closed on
Mar 25, 1999
Sold by
Manges Jane Ranee
Bought by
Manges Loren Elmer
Purchase Details
Closed on
Dec 16, 1993
Sold by
Va
Bought by
Manges Loren E and Manges Jane Ranee
Home Financials for this Owner
Home Financials are based on the most recent Mortgage that was taken out on this home.
Original Mortgage
$126,000
Interest Rate
3.87%
Create a Home Valuation Report for This Property
The Home Valuation Report is an in-depth analysis detailing your home's value as well as a comparison with similar homes in the area
Home Values in the Area
Average Home Value in this Area
Purchase History
| Date | Buyer | Sale Price | Title Company |
|---|---|---|---|
| Manges Loren E | -- | None Available | |
| Manges Loren E | -- | Fidelity National Title | |
| Manges Loren Elmer | -- | -- | |
| Manges Loren E | -- | -- |
Source: Public Records
Mortgage History
| Date | Status | Borrower | Loan Amount |
|---|---|---|---|
| Open | Manges Loren E | $240,000 | |
| Closed | Manges Loren E | $126,000 |
Source: Public Records
Tax History Compared to Growth
Tax History
| Year | Tax Paid | Tax Assessment Tax Assessment Total Assessment is a certain percentage of the fair market value that is determined by local assessors to be the total taxable value of land and additions on the property. | Land | Improvement |
|---|---|---|---|---|
| 2025 | $3,361 | $312,684 | $106,081 | $206,603 |
| 2024 | $3,361 | $306,553 | $104,001 | $202,552 |
| 2023 | $3,238 | $300,543 | $101,962 | $198,581 |
| 2022 | $3,194 | $294,651 | $99,963 | $194,688 |
| 2021 | $3,171 | $288,874 | $98,003 | $190,871 |
| 2020 | $3,173 | $285,913 | $96,999 | $188,914 |
| 2019 | $3,119 | $280,308 | $95,098 | $185,210 |
| 2018 | $3,034 | $274,813 | $93,234 | $181,579 |
| 2017 | $2,978 | $269,425 | $91,406 | $178,019 |
| 2016 | $2,947 | $264,143 | $89,614 | $174,529 |
| 2015 | $2,850 | $260,177 | $88,269 | $171,908 |
| 2014 | $2,850 | $255,083 | $86,541 | $168,542 |
Source: Public Records
Map
Nearby Homes
- 3284 Oxford Rd
- 10-acre Cameron Park Dr
- 3120 Oxford Rd
- 3400 Oxford Ct
- 3379 Cambridge Rd
- 3196 Sudbury Rd
- 3505 Fairway Dr
- 3218 Cambridge Rd
- 3508 Fairway Dr
- 3053 Cambridge Rd
- 3133 Cambridge Rd Unit 3
- 3044 Boeing Rd
- 993 Camerado Dr
- 3115 Cambridge Rd
- 980 Camerado Dr
- 3039 Estepa Dr Unit 6E
- 3100 Cambridge Rd Unit 3E
- 2940 Pasada Rd
- 3271 Woodleigh Ln
- 3545 Montclair Rd