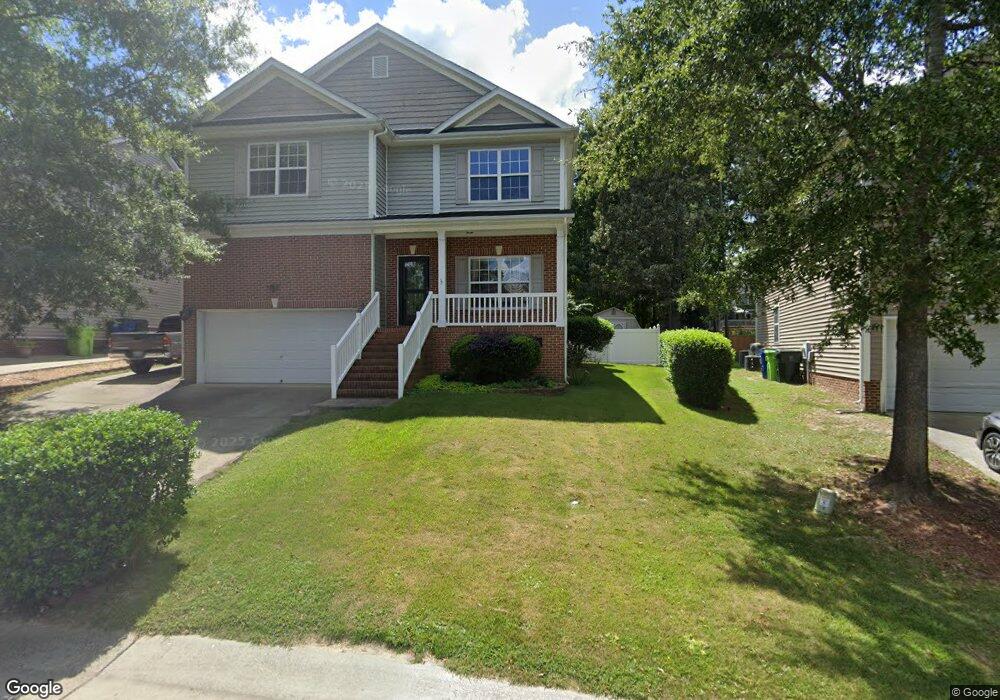
3230 Enchanting Way Raleigh, NC 27616
Forestville NeighborhoodEstimated Value: $411,000 - $426,828
5
Beds
4
Baths
2,493
Sq Ft
$167/Sq Ft
Est. Value
About This Home
This home is located at 3230 Enchanting Way, Raleigh, NC 27616 and is currently estimated at $417,457, approximately $167 per square foot. 3230 Enchanting Way is a home located in Wake County with nearby schools including Harris Creek Elementary School, Rolesville Middle School, and Rolesville High School.
Ownership History
Date
Name
Owned For
Owner Type
Purchase Details
Closed on
Nov 26, 2014
Sold by
Us Bank N A
Bought by
Kalimba Charles and Kalimba Francine
Current Estimated Value
Home Financials for this Owner
Home Financials are based on the most recent Mortgage that was taken out on this home.
Original Mortgage
$193,000
Outstanding Balance
$150,934
Interest Rate
4.5%
Mortgage Type
Adjustable Rate Mortgage/ARM
Estimated Equity
$266,523
Purchase Details
Closed on
Feb 28, 2014
Sold by
Oneal Beverly D and Oneal Walter C
Bought by
Us Bank Na
Purchase Details
Closed on
Jan 20, 2006
Sold by
Beazer Homes Corp
Bought by
Oneal Walter C and Oneal Beverly D
Home Financials for this Owner
Home Financials are based on the most recent Mortgage that was taken out on this home.
Original Mortgage
$44,348
Interest Rate
5.82%
Mortgage Type
Stand Alone Second
Create a Home Valuation Report for This Property
The Home Valuation Report is an in-depth analysis detailing your home's value as well as a comparison with similar homes in the area
Home Values in the Area
Average Home Value in this Area
Purchase History
| Date | Buyer | Sale Price | Title Company |
|---|---|---|---|
| Kalimba Charles | $195,000 | None Available | |
| Us Bank Na | $160,650 | None Available | |
| Oneal Walter C | $222,000 | None Available |
Source: Public Records
Mortgage History
| Date | Status | Borrower | Loan Amount |
|---|---|---|---|
| Open | Kalimba Charles | $193,000 | |
| Previous Owner | Oneal Walter C | $44,348 | |
| Previous Owner | Oneal Walter C | $177,392 |
Source: Public Records
Tax History Compared to Growth
Tax History
| Year | Tax Paid | Tax Assessment Tax Assessment Total Assessment is a certain percentage of the fair market value that is determined by local assessors to be the total taxable value of land and additions on the property. | Land | Improvement |
|---|---|---|---|---|
| 2025 | $3,567 | $406,731 | $100,000 | $306,731 |
| 2024 | $3,552 | $406,731 | $100,000 | $306,731 |
| 2023 | $2,789 | $254,045 | $45,000 | $209,045 |
| 2022 | $2,592 | $254,045 | $45,000 | $209,045 |
| 2021 | $2,492 | $254,045 | $45,000 | $209,045 |
| 2020 | $2,447 | $254,045 | $45,000 | $209,045 |
| 2019 | $2,622 | $224,484 | $32,000 | $192,484 |
| 2018 | $2,473 | $224,484 | $32,000 | $192,484 |
| 2017 | $2,332 | $221,610 | $32,000 | $189,610 |
| 2016 | $2,278 | $221,610 | $32,000 | $189,610 |
| 2015 | $2,390 | $228,834 | $38,000 | $190,834 |
| 2014 | -- | $228,834 | $38,000 | $190,834 |
Source: Public Records
Map
Nearby Homes
- 3420 Ribcowski Ct
- 3348 Daingerfield Dr
- 3617 Culater Ct
- 3421 Pritchard Ct
- 6616 Speight Cir
- 3600 Cadler Ct
- 3212 Potthast Ct
- 3609 Singleleaf Ln
- 3421 Tunas St
- 4132 Breadfruit Ct
- 3912 Cashew Dr
- 3626 Jordan Mill Ct
- 4124 Mangrove Dr
- 4017 Rothfield Ln
- 4018 Rothfield Ln
- 3205 Suncrest Village Ln
- 3814 Tyler Bluff Ln
- 8000 Mill Bluff Ct
- 8004 Mill Bluff Ct
- 3153 Suncrest Village Ln
- 3407 Weir Way Unit OS
- 3407 Weir Way
- 3234 Enchanting Way
- 3238 Enchanting Way
- 3222 Enchanting Way
- 3505 Dewing Dr
- 3227 Enchanting Way
- 3501 Weir Way
- 3401 Weir Way
- 3504 Kensett Way
- 3218 Enchanting Way
- 3501 Dewing Dr
- 3505 Weir Way
- 3212 Enchanting Way
- 3213 Enchanting Way
- 3509 Weir Way
- 3416 Weir Way
- 3500 Weir Way
- 3412 Weir Way
- 3504 Weir Way