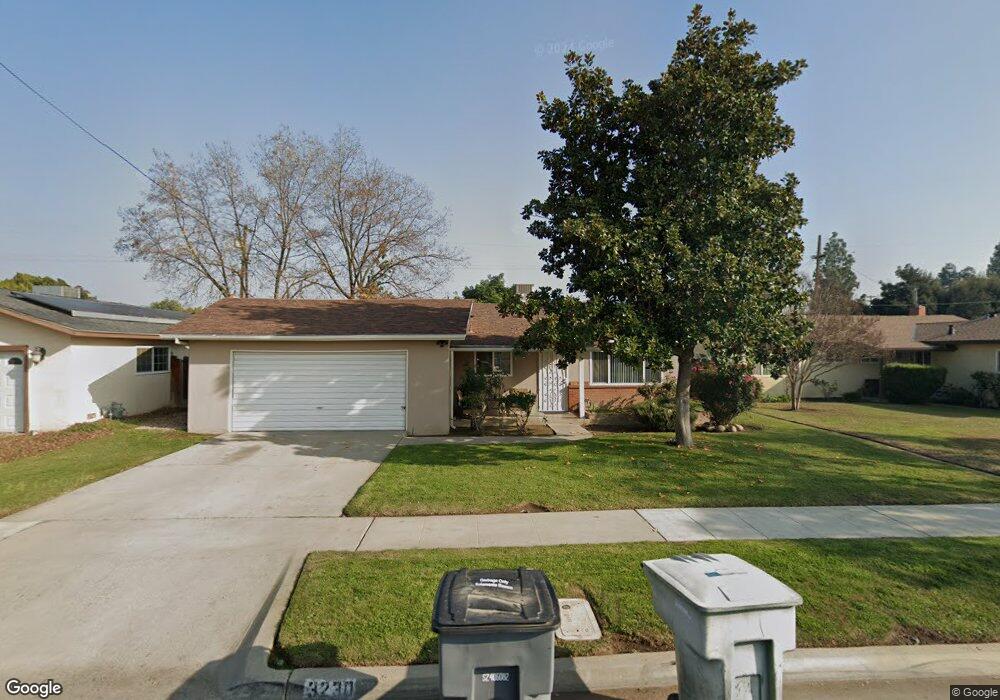
3230 N Stanford Ave Fresno, CA 93727
McLane NeighborhoodEstimated Value: $294,000 - $329,000
3
Beds
2
Baths
1,040
Sq Ft
$293/Sq Ft
Est. Value
About This Home
This home is located at 3230 N Stanford Ave, Fresno, CA 93727 and is currently estimated at $305,023, approximately $293 per square foot. 3230 N Stanford Ave is a home located in Fresno County with nearby schools including Reyburn Intermediate School and Clovis East High School.
Ownership History
Date
Name
Owned For
Owner Type
Purchase Details
Closed on
Jun 27, 2016
Sold by
Mcguire Timothy Joseph and Mcguire Carol Ann
Bought by
Mcguire Timothy Joseph and Mcgui Carol Ann
Current Estimated Value
Purchase Details
Closed on
Sep 9, 1994
Sold by
Capistran Deceased Maria
Bought by
Capistran Ramon G and Capistran Maria Louisa
Home Financials for this Owner
Home Financials are based on the most recent Mortgage that was taken out on this home.
Original Mortgage
$44,800
Interest Rate
8.57%
Purchase Details
Closed on
Aug 17, 1994
Sold by
Giddings Maria Louisa and Capistran Maria Louisa
Bought by
Mcguire Timothy J and Mcguire Carol A
Home Financials for this Owner
Home Financials are based on the most recent Mortgage that was taken out on this home.
Original Mortgage
$44,800
Interest Rate
8.57%
Create a Home Valuation Report for This Property
The Home Valuation Report is an in-depth analysis detailing your home's value as well as a comparison with similar homes in the area
Home Values in the Area
Average Home Value in this Area
Purchase History
| Date | Buyer | Sale Price | Title Company |
|---|---|---|---|
| Mcguire Timothy Joseph | -- | None Available | |
| Capistran Ramon G | -- | American Title Co | |
| Mcguire Timothy J | $56,000 | American Title Insurance | |
| Giddings Maria Capistran | -- | American Title Co | |
| Giddings Maria Louisa | -- | American Title Company |
Source: Public Records
Mortgage History
| Date | Status | Borrower | Loan Amount |
|---|---|---|---|
| Closed | Mcguire Timothy J | $44,800 |
Source: Public Records
Tax History Compared to Growth
Tax History
| Year | Tax Paid | Tax Assessment Tax Assessment Total Assessment is a certain percentage of the fair market value that is determined by local assessors to be the total taxable value of land and additions on the property. | Land | Improvement |
|---|---|---|---|---|
| 2025 | $1,134 | $94,028 | $30,216 | $63,812 |
| 2023 | $1,113 | $90,379 | $29,044 | $61,335 |
| 2022 | $1,098 | $88,608 | $28,475 | $60,133 |
| 2021 | $1,068 | $86,871 | $27,917 | $58,954 |
| 2020 | $1,064 | $85,981 | $27,631 | $58,350 |
| 2019 | $1,044 | $84,296 | $27,090 | $57,206 |
| 2018 | $1,021 | $82,644 | $26,559 | $56,085 |
| 2017 | $1,004 | $81,025 | $26,039 | $54,986 |
| 2016 | $971 | $79,437 | $25,529 | $53,908 |
| 2015 | $956 | $78,245 | $25,146 | $53,099 |
| 2014 | -- | $76,713 | $24,654 | $52,059 |
Source: Public Records
Map
Nearby Homes
- 3322 N Ezie Ave
- 5965 E Shields Ave Unit 145
- 3550 N Duke Ave Unit 37
- 3550 N Duke Ave Unit 5
- 3554 N Duke Ave Unit 125
- 3556 N Duke Ave Unit 175
- 5822 E Ramona Ave
- 6030 E Dayton Ave
- 6083 E Andrews Ave
- 3734 Manila Ave
- 5934 E Dakota Ave
- 2886 N Sophie Dr
- 2604 N Mcarthur Ave
- 3644 Manila Ave
- 2870 N Sophie Dr
- 5835 E Saginaw Way
- 6236 E Garland Ave
- 5833 E Pontiac Way
- The Bella Plan at The Landing at Belterra - Traditional
- The Pasatiempo Plan at The Landing at Belterra - Traditional
- 3242 N Stanford Ave
- 3218 N Stanford Ave
- 3229 N Ezie Ave
- 3304 N Stanford Ave
- 3206 N Stanford Ave
- 3219 N Ezie Ave
- 3241 N Ezie Ave
- 3217 N Ezie Ave
- 3303 N Ezie Ave
- 3205 N Ezie Ave
- 3231 N Stanford Ave
- 3243 N Stanford Ave
- 3219 N Stanford Ave
- 3314 N Stanford Ave
- 3305 N Stanford Ave
- 3207 N Stanford Ave
- 3313 N Ezie Ave
- 3324 N Stanford Ave
- 3323 N Ezie Ave