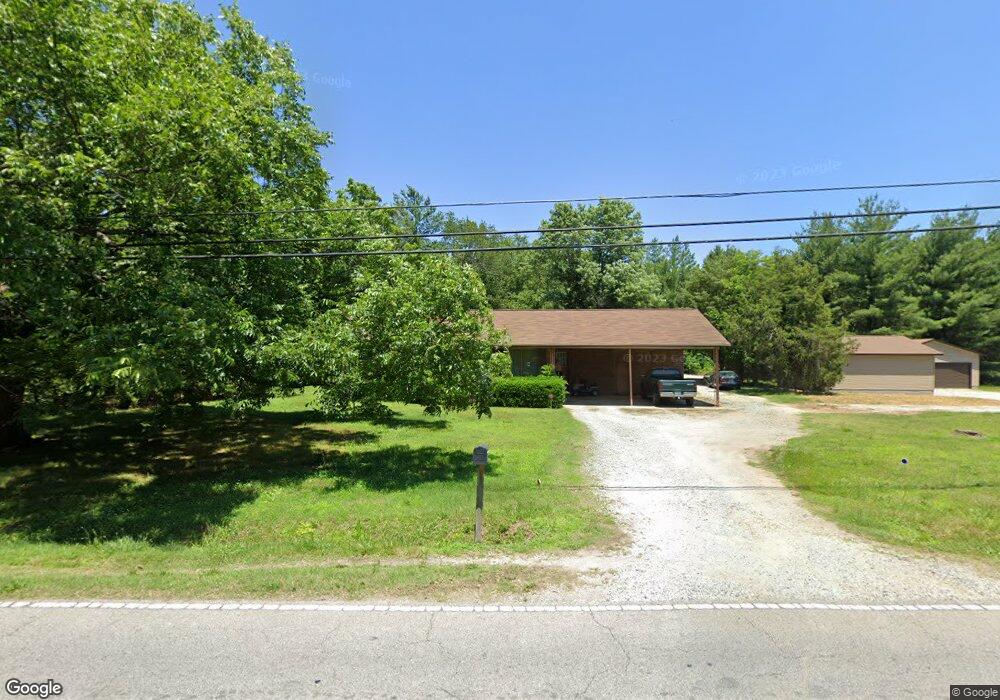
3230 W Innes St Salisbury, NC 28144
Estimated Value: $236,000 - $272,567
--
Bed
1
Bath
1,355
Sq Ft
$186/Sq Ft
Est. Value
About This Home
This home is located at 3230 W Innes St, Salisbury, NC 28144 and is currently estimated at $251,892, approximately $185 per square foot. 3230 W Innes St is a home located in Rowan County with nearby schools including H D Isenberg Elementary, Knox Middle School, and North Rowan Middle School.
Ownership History
Date
Name
Owned For
Owner Type
Purchase Details
Closed on
Oct 29, 2024
Sold by
Pfeiffer University
Bought by
Huneycutt Larry L and Huneycutt Sonya O
Current Estimated Value
Purchase Details
Closed on
Jan 5, 2017
Sold by
Shaver Joseph Scott
Bought by
Shaver Joseph Scott
Purchase Details
Closed on
Jan 1, 1987
Bought by
Shaver Joseph Scott
Create a Home Valuation Report for This Property
The Home Valuation Report is an in-depth analysis detailing your home's value as well as a comparison with similar homes in the area
Home Values in the Area
Average Home Value in this Area
Purchase History
| Date | Buyer | Sale Price | Title Company |
|---|---|---|---|
| Huneycutt Larry L | -- | None Listed On Document | |
| Huneycutt Larry L | $245,000 | None Listed On Document | |
| Huneycutt Larry L | $245,000 | None Listed On Document | |
| Shaver Joseph Scott | -- | None Available | |
| Shaver Joseph Scott | -- | -- |
Source: Public Records
Tax History Compared to Growth
Tax History
| Year | Tax Paid | Tax Assessment Tax Assessment Total Assessment is a certain percentage of the fair market value that is determined by local assessors to be the total taxable value of land and additions on the property. | Land | Improvement |
|---|---|---|---|---|
| 2025 | $1,831 | $273,348 | $59,501 | $213,847 |
| 2024 | $1,831 | $273,348 | $59,501 | $213,847 |
| 2023 | $1,619 | $241,672 | $59,501 | $182,171 |
| 2022 | $1,422 | $190,201 | $44,957 | $145,244 |
| 2021 | $1,190 | $163,189 | $33,585 | $129,604 |
| 2020 | $1,190 | $163,189 | $33,585 | $129,604 |
| 2019 | $1,190 | $163,189 | $33,585 | $129,604 |
| 2018 | $1,113 | $153,913 | $33,490 | $120,423 |
| 2017 | $851 | $117,640 | $21,801 | $95,839 |
| 2016 | $851 | $117,640 | $21,801 | $95,839 |
| 2015 | $798 | $108,655 | $21,801 | $86,854 |
| 2014 | $822 | $114,192 | $21,801 | $92,391 |
Source: Public Records
Map
Nearby Homes
- 1131 Amberlight Cir
- 3265 W Innes St
- 1125 Silvertrace Dr
- 1219 Amberlight Cir
- 1405 Amberlight Cir
- 3226 Player Ct
- 3218 Player Ct
- 3105 Player Ct
- 3222 Player Ct
- 310 Jacobs Dr
- 506 Muirfield Way
- 501 Muirfield Way
- 543 Muirfield Way
- 109 Lancaster Ct Unit 233
- 417 Rugby Rd
- 413 Rugby Rd
- 250 Greenway Dr
- 407 Rugby Rd
- 205 Windsor Dr
- 313 Rugby Rd
- 3230 W Innes St
- 3225 W Innes St
- 3260 W Innes St
- 3180 W Innes St
- 3240 W Innes St
- 3185 W Innes St
- 3245 W Innes St
- 3150 W Innes St
- 3181 W Innes St
- 3270 W Innes St
- 3175 W Innes St
- 3275 W Innes St
- 1169 Amberlight Cir Unit 17
- 1169 Amberlight Cir Unit 151
- 1161 Amberlight Cir
- 1161 Amberlight Cir Unit 16
- 1195 Amberlight Cir
- 1179 Amberlight Cir Unit 18
- 1179 Amberlight Cir
- 1195 Amberlight Cir