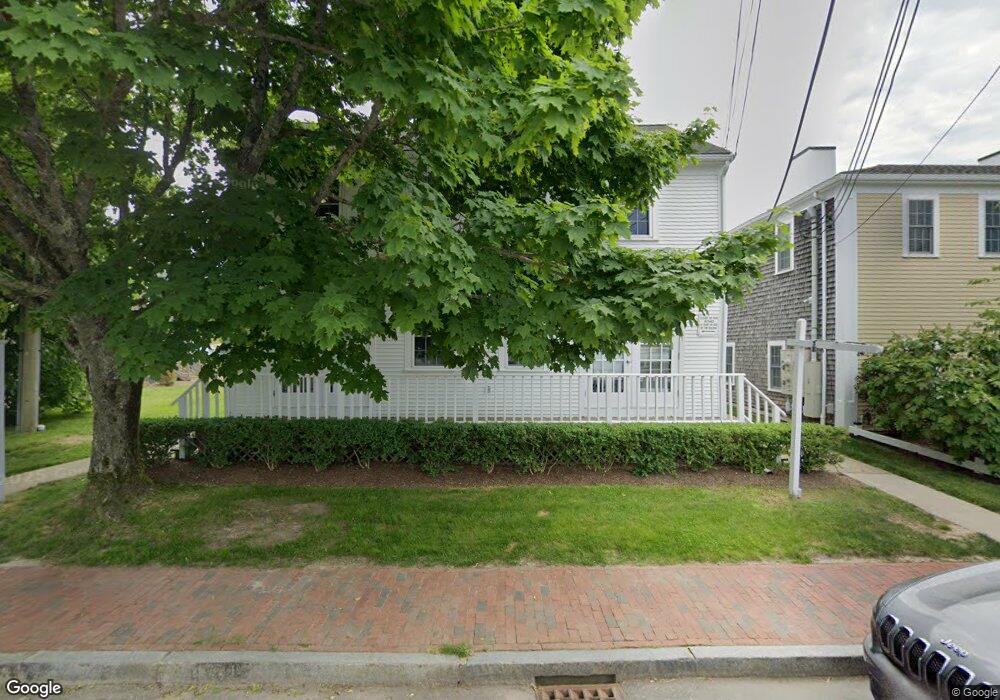
3231 Main St Barnstable, MA 02630
Barnstable Village NeighborhoodEstimated Value: $3,863,544
Studio
3
Baths
6,496
Sq Ft
$595/Sq Ft
Est. Value
About This Home
This home is located at 3231 Main St, Barnstable, MA 02630 and is currently estimated at $3,863,544, approximately $594 per square foot. 3231 Main St is a home located in Barnstable County with nearby schools including West Barnstable Elementary School, Barnstable United Elementary School, and Barnstable Intermediate School.
Ownership History
Date
Name
Owned For
Owner Type
Purchase Details
Closed on
Jan 10, 2018
Sold by
3239 Main Llc
Bought by
Tr 3231 Main Street Ll
Current Estimated Value
Home Financials for this Owner
Home Financials are based on the most recent Mortgage that was taken out on this home.
Original Mortgage
$1,750,000
Outstanding Balance
$1,475,280
Interest Rate
3.9%
Mortgage Type
Unknown
Estimated Equity
$2,388,264
Purchase Details
Closed on
Sep 15, 2017
Sold by
Exchange Swift Llc
Bought by
3239 Main Llc
Home Financials for this Owner
Home Financials are based on the most recent Mortgage that was taken out on this home.
Original Mortgage
$1,000,000
Interest Rate
3.93%
Mortgage Type
Commercial
Purchase Details
Closed on
Jun 2, 2008
Sold by
Dab Rt
Bought by
Exchange Swift Llc
Home Financials for this Owner
Home Financials are based on the most recent Mortgage that was taken out on this home.
Original Mortgage
$950,000
Interest Rate
5.91%
Mortgage Type
Commercial
Purchase Details
Closed on
May 2, 1995
Sold by
Northside Rt
Bought by
Dab Rt
Create a Home Valuation Report for This Property
The Home Valuation Report is an in-depth analysis detailing your home's value as well as a comparison with similar homes in the area
Home Values in the Area
Average Home Value in this Area
Purchase History
| Date | Buyer | Sale Price | Title Company |
|---|---|---|---|
| Tr 3231 Main Street Ll | $2,000,000 | -- | |
| 3239 Main Llc | -- | -- | |
| Exchange Swift Llc | $1,210,000 | -- | |
| Dab Rt | $370,000 | -- |
Source: Public Records
Mortgage History
| Date | Status | Borrower | Loan Amount |
|---|---|---|---|
| Open | Tr 3231 Main Street Ll | $1,750,000 | |
| Previous Owner | 3239 Main Llc | $1,000,000 | |
| Previous Owner | Dab Rt | $600,000 | |
| Previous Owner | Exchange Swift Llc | $950,000 | |
| Previous Owner | Dab Rt | $500,000 | |
| Previous Owner | Dab Rt | $330,000 |
Source: Public Records
Tax History
| Year | Tax Paid | Tax Assessment Tax Assessment Total Assessment is a certain percentage of the fair market value that is determined by local assessors to be the total taxable value of land and additions on the property. | Land | Improvement |
|---|---|---|---|---|
| 2025 | $14,404 | $1,714,800 | $464,600 | $1,250,200 |
| 2024 | $13,691 | $1,705,000 | $464,600 | $1,240,400 |
| 2023 | $14,220 | $1,705,000 | $464,600 | $1,240,400 |
| 2022 | $15,359 | $1,481,100 | $418,100 | $1,063,000 |
| 2021 | $16,100 | $1,481,100 | $418,100 | $1,063,000 |
| 2020 | $11,936 | $1,047,000 | $386,600 | $660,400 |
| 2019 | $11,867 | $1,047,400 | $386,600 | $660,800 |
| 2018 | $11,919 | $1,020,500 | $386,600 | $633,900 |
| 2017 | $11,745 | $1,012,500 | $386,600 | $625,900 |
| 2016 | $11,573 | $1,012,500 | $386,600 | $625,900 |
| 2015 | $10,490 | $935,800 | $371,400 | $564,400 |
Source: Public Records
Map
Nearby Homes
- 0 Indian Trail
- 3528 Main St
- 93 Harris Meadow Ln
- 69 Allyn Ln
- 2656 Main St
- 0 Phinneys Ln
- 30 Indian Trail
- 11 Shepherds Way
- 79 Bayberry Ln
- 41 Dromoland Ln
- 44 Iris Ln
- 210 Attucks Ln
- 230 Attucks Ln
- 34 Black Duck Ln
- 65 Oakmont Rd
- 4390 Main St
- 5 Chickadee Ln
- 800 Bearses Way Unit 2SB
- 800 Bearses Way Unit 3NF
- 800 Bearses Way Unit 5NB
- 0 Main Unit 70829207
- 0 Main Unit 70860594
- 0 Main Unit 7027570
- 0 Main Unit 5012252
- 3231 Main Route 6a St
- 3239 Main Route 6a St
- 3225 Main Route 6a St
- 3239 Main St
- 3225 Main St Unit 1
- 3225 Main St
- 3219 Main St
- 3217 Main Rte 6a(barn ) St
- 3249 Main St
- 3217 Main St
- 3224 Main St
- 3240 Main St
- 3226 Main St
- 3220 Main St Unit Rear
- 3220 Main St
- 3252 Main St
Your Personal Tour Guide
Ask me questions while you tour the home.