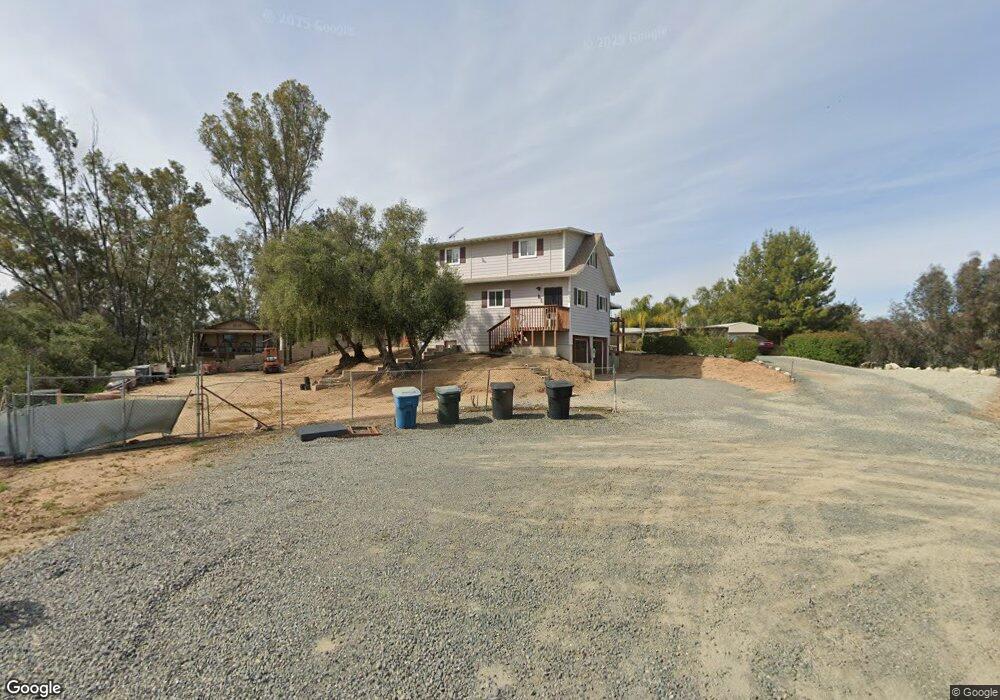
32310 Flanders Ln Wildomar, CA 92595
East Lake District NeighborhoodEstimated Value: $475,545 - $629,000
2
Beds
1
Bath
768
Sq Ft
$731/Sq Ft
Est. Value
About This Home
This home is located at 32310 Flanders Ln, Wildomar, CA 92595 and is currently estimated at $561,386, approximately $730 per square foot. 32310 Flanders Ln is a home located in Riverside County with nearby schools including William Collier Elementary School, David A. Brown Middle School, and Elsinore High School.
Ownership History
Date
Name
Owned For
Owner Type
Purchase Details
Closed on
Oct 25, 2021
Sold by
Jones Mark D and Jones Lucille C
Bought by
Jones Lucille C
Current Estimated Value
Purchase Details
Closed on
Apr 21, 2016
Sold by
Jones Mark D and Jones Lucille C
Bought by
The Mark & Lucille Jones Living Trust
Purchase Details
Closed on
Mar 5, 1998
Sold by
Cleveland Gene N and Cleveland Robert J E Exemption Family Tr
Bought by
Jones Mark D and Jones Lucille C
Home Financials for this Owner
Home Financials are based on the most recent Mortgage that was taken out on this home.
Original Mortgage
$49,000
Outstanding Balance
$8,948
Interest Rate
7%
Mortgage Type
Seller Take Back
Estimated Equity
$552,438
Purchase Details
Closed on
Dec 9, 1994
Sold by
Cleveland Gene N
Bought by
Cleveland Gene N
Create a Home Valuation Report for This Property
The Home Valuation Report is an in-depth analysis detailing your home's value as well as a comparison with similar homes in the area
Home Values in the Area
Average Home Value in this Area
Purchase History
| Date | Buyer | Sale Price | Title Company |
|---|---|---|---|
| Jones Lucille C | -- | Chicago Title Company | |
| The Mark & Lucille Jones Living Trust | -- | None Available | |
| Jones Mark D | $50,000 | First American Title Ins Co | |
| Cleveland Gene N | -- | -- |
Source: Public Records
Mortgage History
| Date | Status | Borrower | Loan Amount |
|---|---|---|---|
| Open | Jones Mark D | $49,000 |
Source: Public Records
Tax History Compared to Growth
Tax History
| Year | Tax Paid | Tax Assessment Tax Assessment Total Assessment is a certain percentage of the fair market value that is determined by local assessors to be the total taxable value of land and additions on the property. | Land | Improvement |
|---|---|---|---|---|
| 2025 | $1,096 | $111,734 | $31,915 | $79,819 |
| 2023 | $1,096 | $107,397 | $30,677 | $76,720 |
| 2022 | $1,059 | $105,292 | $30,076 | $75,216 |
| 2021 | $1,038 | $103,229 | $29,487 | $73,742 |
| 2020 | $1,027 | $102,171 | $29,185 | $72,986 |
| 2019 | $1,006 | $100,168 | $28,613 | $71,555 |
| 2018 | $986 | $98,204 | $28,053 | $70,151 |
| 2017 | $966 | $96,279 | $27,503 | $68,776 |
| 2016 | $930 | $94,392 | $26,964 | $67,428 |
| 2015 | $921 | $92,976 | $26,560 | $66,416 |
| 2014 | $894 | $91,157 | $26,041 | $65,116 |
Source: Public Records
Map
Nearby Homes
- 20520 Como St
- 20304 Palomar St
- 34535 Lacasella Ct
- 20691 Como St
- 32720 Webb Dr
- 20734 Como St
- 20220 Union St
- 32802 Sheila Ln
- 34230 Dorof Ct
- 34146 Dorof Ct
- 21601 Canyon Dr Unit 42
- 21601 Canyon Dr Unit 4
- 32858 Alderbrook Rd
- 32841 Alderbrook Rd
- 20980 Palomar St
- 20144 Hill Spring Rd
- 21026 Palomar St
- 33213 Hixon St
- 20787 Alameda Del Monte
- 20463 Fox Den Rd
- 32380 Bryant St
- 32330 Flanders Ln
- 34915 Mission Trail
- 20550 Palomar St
- 32476 Bryant St
- 32476 Bryant St Unit 1
- 20440 Palomar St
- 20500 Como St
- 20422 Palomar St
- 20492 Palomar St
- 20410 Palomar St
- 34946 Mission Trail
- 20505 Palomar St
- 34950 Mission Trail
- 32351 Bryant St
- 32401 Bryant St
- 34860 Mission Trail
- 20511 Bryant St
- 32490 Bryant St
- 34850 Mission Trail