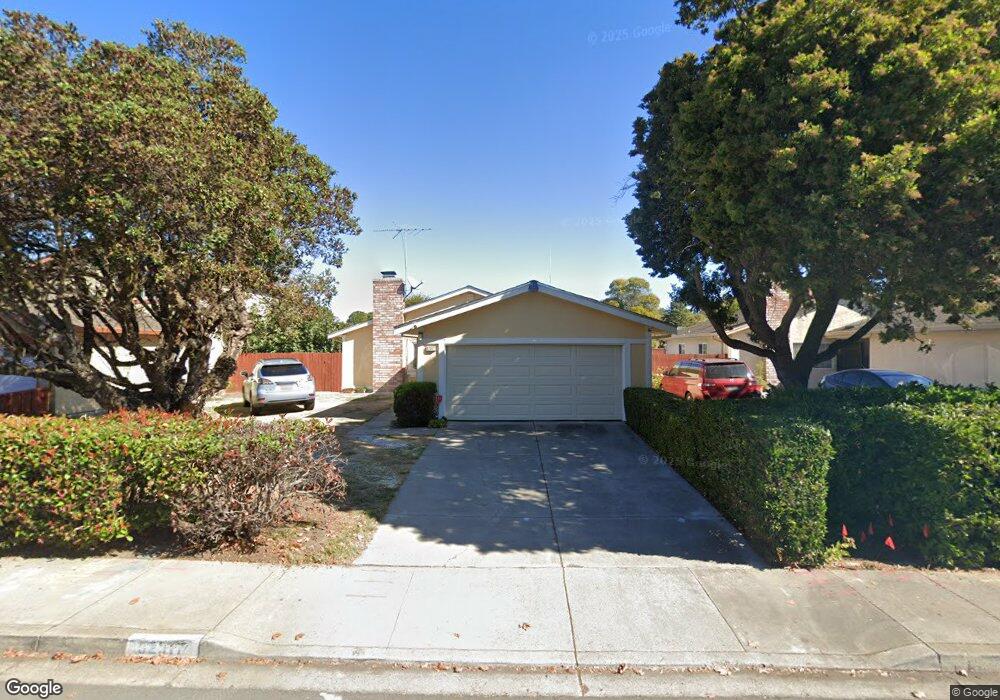
32317 Meteor Dr Union City, CA 94587
Alvarado NeighborhoodEstimated Value: $1,024,000 - $1,198,000
3
Beds
2
Baths
1,180
Sq Ft
$932/Sq Ft
Est. Value
About This Home
This home is located at 32317 Meteor Dr, Union City, CA 94587 and is currently estimated at $1,100,083, approximately $932 per square foot. 32317 Meteor Dr is a home located in Alameda County with nearby schools including Pioneer Elementary School, Itliong-Vera Cruz, and James Logan High School.
Ownership History
Date
Name
Owned For
Owner Type
Purchase Details
Closed on
Apr 12, 2012
Sold by
Ou Wilson Wei Jian and Shen Xue Fang
Bought by
Ou Wilson Wei Jian and Shen Xue Fang
Current Estimated Value
Home Financials for this Owner
Home Financials are based on the most recent Mortgage that was taken out on this home.
Original Mortgage
$235,000
Outstanding Balance
$161,780
Interest Rate
3.84%
Mortgage Type
New Conventional
Estimated Equity
$938,303
Purchase Details
Closed on
Jun 9, 2000
Sold by
Lee Sok C and Son Ok H
Bought by
Ou Wei Jian and Shen Xue Fang
Home Financials for this Owner
Home Financials are based on the most recent Mortgage that was taken out on this home.
Original Mortgage
$252,700
Interest Rate
8.53%
Purchase Details
Closed on
Jun 26, 1997
Sold by
Soh Lee Sok C and Soh Ok
Bought by
Lee Sok Chu and Son Ok Hee
Purchase Details
Closed on
Jun 11, 1997
Sold by
Lee Hyun C and Lee Sok C
Bought by
Lee Sok Chu and Son Ok Hee
Create a Home Valuation Report for This Property
The Home Valuation Report is an in-depth analysis detailing your home's value as well as a comparison with similar homes in the area
Home Values in the Area
Average Home Value in this Area
Purchase History
| Date | Buyer | Sale Price | Title Company |
|---|---|---|---|
| Ou Wilson Wei Jian | -- | Chicago Title Company | |
| Ou Wei Jian | $325,000 | Old Republic Title Company | |
| Lee Sok Chu | -- | -- | |
| Lee Sok Chu | -- | -- |
Source: Public Records
Mortgage History
| Date | Status | Borrower | Loan Amount |
|---|---|---|---|
| Open | Ou Wilson Wei Jian | $235,000 | |
| Closed | Ou Wei Jian | $252,700 |
Source: Public Records
Tax History
| Year | Tax Paid | Tax Assessment Tax Assessment Total Assessment is a certain percentage of the fair market value that is determined by local assessors to be the total taxable value of land and additions on the property. | Land | Improvement |
|---|---|---|---|---|
| 2025 | $7,582 | $492,488 | $149,846 | $349,642 |
| 2024 | $7,582 | $482,696 | $146,909 | $342,787 |
| 2023 | $7,317 | $480,095 | $144,028 | $336,067 |
| 2022 | $7,176 | $463,684 | $141,205 | $329,479 |
| 2021 | $7,015 | $454,457 | $138,437 | $323,020 |
| 2020 | $6,891 | $456,728 | $137,018 | $319,710 |
| 2019 | $6,949 | $447,774 | $134,332 | $313,442 |
| 2018 | $6,785 | $438,996 | $131,699 | $307,297 |
| 2017 | $6,622 | $430,390 | $129,117 | $301,273 |
| 2016 | $6,382 | $421,953 | $126,586 | $295,367 |
| 2015 | $6,258 | $415,615 | $124,684 | $290,931 |
| 2014 | $6,023 | $407,474 | $122,242 | $285,232 |
Source: Public Records
Map
Nearby Homes
- 4311 Blondwood Ct
- 32060 Paloma Ct
- 4513 Birchwood Ct
- 32508 Regents Blvd
- 4469 Fellows St
- 3274 Santa Rosa Ct
- 32301 Ruth Ct
- 4625 Ruth Way
- 32409 Elizabeth Way
- 3337 San Pablo Ct
- 31391 San Diego Ct
- 4600 Delores Dr
- 4541 Darcelle Dr
- 4262 Las Feliz Ct
- 4648 Michelle Ct
- 3965 Lake Tahoe Terrace
- 3312 San Marco Ct
- 32471 Lake Ree St
- 4701 Michelle Way
- 4636 Granada Way
- 32309 Meteor Dr
- 32325 Meteor Dr
- 32318 Cygnus Ct
- 32310 Cygnus Ct
- 32301 Meteor Dr
- 4253 Gemini Dr
- 4249 Gemini Dr
- 32326 Cygnus Ct
- 32302 Cygnus Ct
- 4245 Gemini Dr
- 4241 Gemini Dr
- 32327 Cygnus Ct
- 4237 Gemini Dr
- 32319 Cygnus Ct
- 32311 Cygnus Ct
- 32504 Endeavour Way
- 4233 Gemini Dr
- 32303 Cygnus Ct
- 32506 Endeavour Way
- 4246 Lunar Way
Your Personal Tour Guide
Ask me questions while you tour the home.