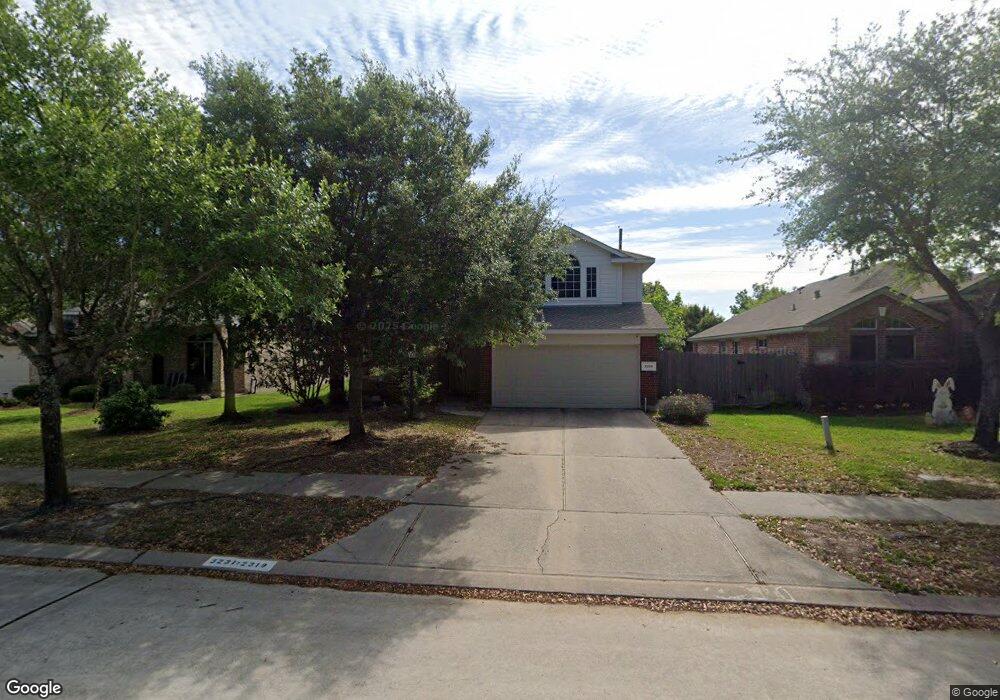
32319 Willow Creek Park Conroe, TX 77385
Imperial Oaks NeighborhoodEstimated Value: $298,000 - $337,000
--
Bed
3
Baths
2,281
Sq Ft
$138/Sq Ft
Est. Value
About This Home
This home is located at 32319 Willow Creek Park, Conroe, TX 77385 and is currently estimated at $315,719, approximately $138 per square foot. 32319 Willow Creek Park is a home located in Montgomery County with nearby schools including Kaufman Elementary School, Vogel Intermediate School, and Irons J High School.
Ownership History
Date
Name
Owned For
Owner Type
Purchase Details
Closed on
Feb 22, 2008
Sold by
Lake Forest Development Llc
Bought by
Johnson Diana R
Current Estimated Value
Home Financials for this Owner
Home Financials are based on the most recent Mortgage that was taken out on this home.
Original Mortgage
$53,910
Interest Rate
5.68%
Mortgage Type
Purchase Money Mortgage
Purchase Details
Closed on
Sep 25, 2003
Sold by
Long Mary Carolyn
Bought by
Johnson Diana R
Home Financials for this Owner
Home Financials are based on the most recent Mortgage that was taken out on this home.
Original Mortgage
$140,650
Interest Rate
6.45%
Mortgage Type
Purchase Money Mortgage
Purchase Details
Closed on
May 3, 2002
Sold by
D R Horton Emerald Ltd
Bought by
Johnson Diana R
Purchase Details
Closed on
Nov 6, 2001
Sold by
Imperial Oaks Joint Venture
Bought by
Johnson Diana R
Create a Home Valuation Report for This Property
The Home Valuation Report is an in-depth analysis detailing your home's value as well as a comparison with similar homes in the area
Home Values in the Area
Average Home Value in this Area
Purchase History
| Date | Buyer | Sale Price | Title Company |
|---|---|---|---|
| Johnson Diana R | -- | Chicago Title | |
| Johnson Diana R | -- | First American Title | |
| Johnson Diana R | -- | -- | |
| Johnson Diana R | -- | -- |
Source: Public Records
Mortgage History
| Date | Status | Borrower | Loan Amount |
|---|---|---|---|
| Closed | Johnson Diana R | $53,910 | |
| Previous Owner | Johnson Diana R | $140,650 |
Source: Public Records
Tax History Compared to Growth
Tax History
| Year | Tax Paid | Tax Assessment Tax Assessment Total Assessment is a certain percentage of the fair market value that is determined by local assessors to be the total taxable value of land and additions on the property. | Land | Improvement |
|---|---|---|---|---|
| 2025 | $4,551 | $257,000 | $50,000 | $207,000 |
| 2024 | $4,035 | $283,712 | -- | -- |
| 2023 | $4,035 | $257,920 | $50,000 | $263,300 |
| 2022 | $5,407 | $234,470 | $13,200 | $266,910 |
| 2021 | $5,292 | $213,150 | $13,200 | $199,950 |
| 2020 | $5,161 | $199,700 | $13,200 | $186,500 |
| 2019 | $5,129 | $203,160 | $13,200 | $189,960 |
| 2018 | $4,243 | $184,950 | $13,200 | $171,750 |
| 2017 | $5,015 | $184,950 | $13,200 | $171,750 |
| 2016 | $4,864 | $179,370 | $13,200 | $166,170 |
| 2015 | $4,073 | $171,390 | $13,200 | $166,170 |
| 2014 | $4,073 | $155,810 | $13,200 | $142,610 |
Source: Public Records
Map
Nearby Homes
- 32331 Summer Park Ln
- 32319 Archer Park
- 32315 Golden Oak Park Ln
- 2614 Winding Creek Way
- 2611 Winding Creek Way
- 2526 Hidden Park Ln
- 31602 Forest Oak Park Ct
- 2103 Winding Hollow Ct
- 31815 Forest Oak Ln
- 2611 Cedar Path Ln
- 31810 Forest Oak Ln
- 31235 Windcrest Park Ln
- 31419 Fountainbrook Park Ln
- 2707 Oak Pass Ct
- 2623 Cedar Path Ln
- 2610 Cedar Path Ln
- 31214 Windcrest Park Ln
- 31903 Burnt Wood Ct
- 2643 Imperial Grove Ln
- 2143 Westover Park Cir
- 32323 Willow Creek Park
- 32315 Willow Creek Park
- 32311 Willow Creek Park
- 32327 Willow Creek Park
- 32318 Summer Park Ln
- 32322 Summer Park Ln
- 32326 Summer Park Ln
- 32314 Summer Park Ln
- 32307 Willow Creek Park
- 32310 Summer Park Ln
- 32330 Summer Park Ln
- 32331 Willow Creek Park
- 32318 Willow Creek Park
- 32322 Willow Creek Park
- 32314 Willow Creek Park
- 32310 Willow Creek Park
- 32310 Willow Creek Park
- 32306 Summer Park Ln
- 32326 Willow Creek Park
- 32334 Summer Park Ln