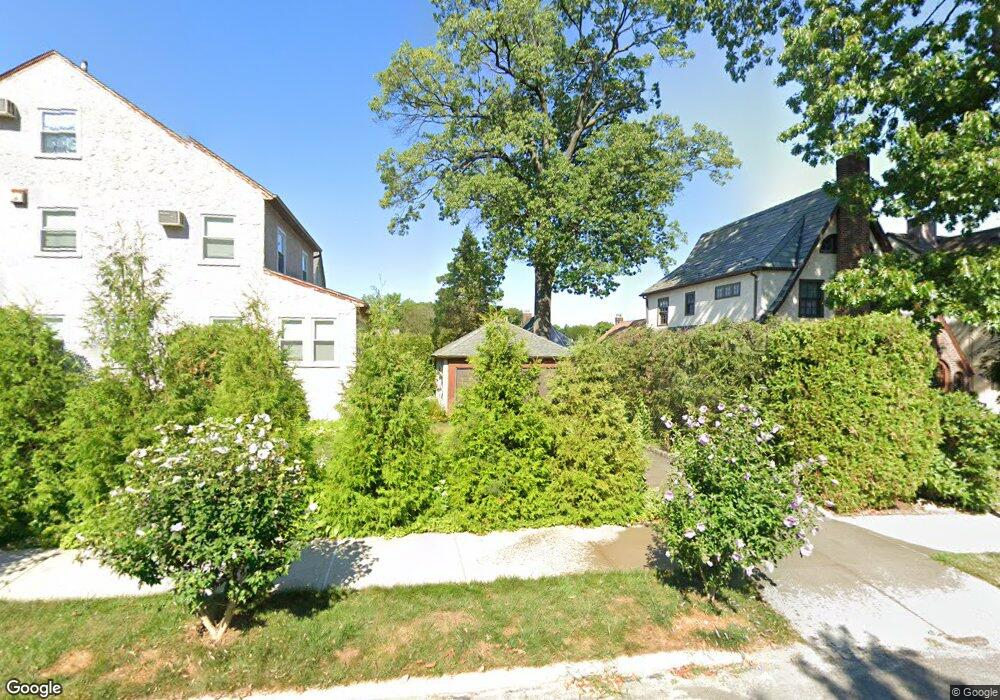
3232 167th St Flushing, NY 11358
Flushing NeighborhoodEstimated Value: $1,185,000 - $1,364,000
4
Beds
2
Baths
1,748
Sq Ft
$730/Sq Ft
Est. Value
About This Home
This home is located at 3232 167th St, Flushing, NY 11358 and is currently estimated at $1,276,055, approximately $730 per square foot. 3232 167th St is a home located in Queens County with nearby schools including P.S. 32 - State Street, I.S. 25 Adrien Block, and Francis Lewis High School.
Ownership History
Date
Name
Owned For
Owner Type
Purchase Details
Closed on
Nov 25, 2014
Sold by
Kaminis George P and Kaminis Theresa
Bought by
Kunsa Alida and Skiba Patrick J
Current Estimated Value
Home Financials for this Owner
Home Financials are based on the most recent Mortgage that was taken out on this home.
Original Mortgage
$260,000
Outstanding Balance
$199,890
Interest Rate
4.02%
Mortgage Type
New Conventional
Estimated Equity
$1,076,165
Create a Home Valuation Report for This Property
The Home Valuation Report is an in-depth analysis detailing your home's value as well as a comparison with similar homes in the area
Home Values in the Area
Average Home Value in this Area
Purchase History
| Date | Buyer | Sale Price | Title Company |
|---|---|---|---|
| Kunsa Alida | $860,000 | -- |
Source: Public Records
Mortgage History
| Date | Status | Borrower | Loan Amount |
|---|---|---|---|
| Open | Kunsa Alida | $260,000 |
Source: Public Records
Tax History
| Year | Tax Paid | Tax Assessment Tax Assessment Total Assessment is a certain percentage of the fair market value that is determined by local assessors to be the total taxable value of land and additions on the property. | Land | Improvement |
|---|---|---|---|---|
| 2025 | $10,345 | $56,081 | $15,352 | $40,729 |
| 2024 | $10,626 | $52,907 | $17,240 | $35,667 |
| 2023 | $9,744 | $49,913 | $16,714 | $33,199 |
| 2022 | $6,835 | $63,300 | $21,780 | $41,520 |
| 2021 | $9,614 | $67,680 | $21,780 | $45,900 |
| 2020 | $9,596 | $58,800 | $21,780 | $37,020 |
| 2019 | $8,930 | $64,740 | $21,780 | $42,960 |
| 2018 | $8,181 | $41,594 | $14,084 | $27,510 |
| 2017 | $7,699 | $39,240 | $15,267 | $23,973 |
| 2016 | $7,535 | $39,240 | $15,267 | $23,973 |
| 2015 | $1,794 | $38,945 | $19,376 | $19,569 |
| 2014 | $1,794 | $36,741 | $21,936 | $14,805 |
Source: Public Records
Map
Nearby Homes
Your Personal Tour Guide
Ask me questions while you tour the home.