Estimated Value: $611,000 - $715,000
4
Beds
3
Baths
2,926
Sq Ft
$219/Sq Ft
Est. Value
About This Home
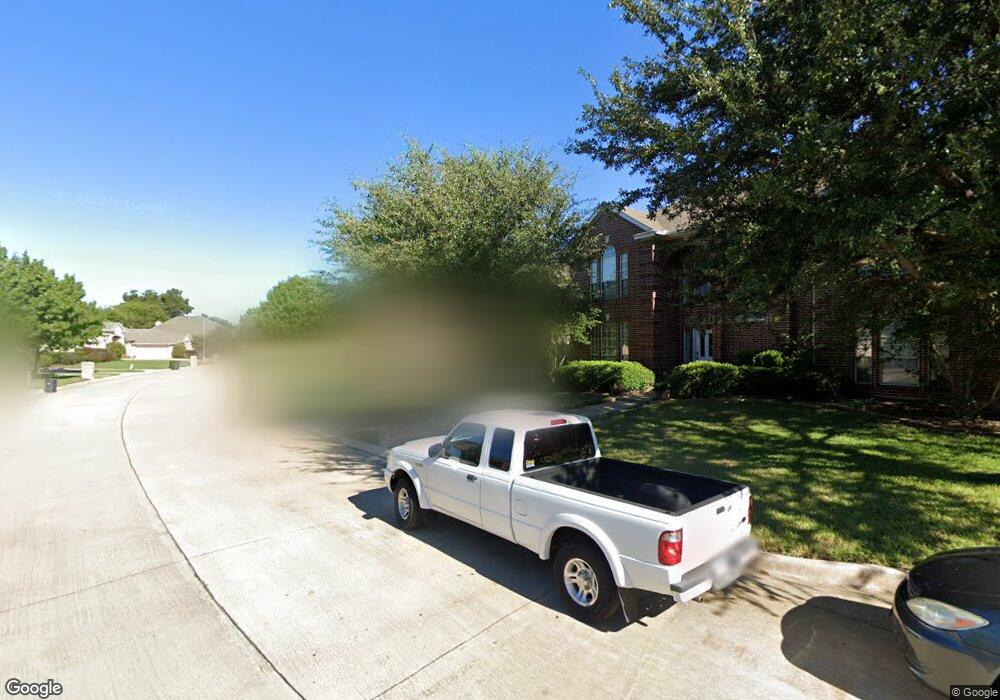
This home is located at 3232 River Bend Dr, Hurst, TX 76054 and is currently estimated at $641,043, approximately $219 per square foot. 3232 River Bend Dr is a home located in Tarrant County with nearby schools including W.A. Porter Elementary School, Smithfield Middle School, and Birdville High School.
Ownership History
Date
Name
Owned For
Owner Type
Purchase Details
Closed on
Sep 8, 2020
Sold by
Williams Norbert T and Williams Sally
Bought by
Rogers Richard Franklin and Richard Franklin Rodgers Jr Re
Current Estimated Value
Purchase Details
Closed on
Jan 24, 2000
Sold by
Elite Custom Homes Inc
Bought by
Williams Norbert T and Williams Sally
Home Financials for this Owner
Home Financials are based on the most recent Mortgage that was taken out on this home.
Original Mortgage
$222,400
Interest Rate
7.95%
Purchase Details
Closed on
Sep 22, 1999
Sold by
Stinson Development Corp
Bought by
Elite Custom Homes Inc
Home Financials for this Owner
Home Financials are based on the most recent Mortgage that was taken out on this home.
Original Mortgage
$195,000
Interest Rate
8.18%
Create a Home Valuation Report for This Property
The Home Valuation Report is an in-depth analysis detailing your home's value as well as a comparison with similar homes in the area
Home Values in the Area
Average Home Value in this Area
Purchase History
| Date | Buyer | Sale Price | Title Company |
|---|---|---|---|
| Rogers Richard Franklin | -- | Rtt | |
| Williams Norbert T | -- | -- | |
| Elite Custom Homes Inc | -- | Safeco Land Title |
Source: Public Records
Mortgage History
| Date | Status | Borrower | Loan Amount |
|---|---|---|---|
| Previous Owner | Williams Norbert T | $222,400 | |
| Previous Owner | Elite Custom Homes Inc | $195,000 |
Source: Public Records
Tax History
| Year | Tax Paid | Tax Assessment Tax Assessment Total Assessment is a certain percentage of the fair market value that is determined by local assessors to be the total taxable value of land and additions on the property. | Land | Improvement |
|---|---|---|---|---|
| 2025 | $7,235 | $572,330 | $90,000 | $482,330 |
| 2024 | $7,235 | $598,315 | $90,000 | $508,315 |
| 2023 | $11,891 | $616,180 | $90,000 | $526,180 |
| 2022 | $11,695 | $476,755 | $65,000 | $411,755 |
| 2021 | $11,154 | $430,000 | $65,000 | $365,000 |
| 2020 | $11,249 | $469,736 | $65,000 | $404,736 |
| 2019 | $10,460 | $397,961 | $65,000 | $332,961 |
| 2018 | $5,266 | $384,717 | $65,000 | $319,717 |
| 2017 | $9,548 | $421,033 | $65,000 | $356,033 |
| 2016 | $8,680 | $362,083 | $35,000 | $327,083 |
| 2015 | $5,220 | $295,700 | $37,500 | $258,200 |
| 2014 | $5,220 | $295,700 | $37,500 | $258,200 |
Source: Public Records
Map
Nearby Homes
- 716 Bridget Way
- 4900 Rockrimmon Ct
- 3220 David Dr
- 3229 David Dr
- 717 Ashley Dr
- 3308 Texas Trail Ct
- 625 Palo Duro Dr
- 3612 Bordeaux Ln
- 108 Glade Rd
- 112 Glade Rd
- 621 Trails End Ct
- 712 Bear Creek Dr
- 2925 Ridgewood Dr
- 713 Corsair Ct
- 712 Doppler Ct
- 3512 Osprey Dr
- Bolsins Plan at Adkins Park
- Bellhaven Plan at Adkins Park
- Grady Plan at Adkins Park
- Hillman Plan at Adkins Park
- 3236 River Bend Dr
- 3228 River Bend Dr
- 621 Natchez Ct
- 3224 River Bend Dr
- 3240 River Bend Dr
- 624 Natchez Ct
- 617 Natchez Ct
- 3231 River Bend Dr
- 3227 River Bend Dr
- 3220 River Bend Dr
- 3235 River Bend Dr
- 3239 River Bend Dr
- 3223 River Bend Dr
- 605 Sabine Ct
- 609 Sabine Ct
- 601 Sabine Ct
- 3241 River Bend Dr
- 3219 River Bend Dr
- 613 Natchez Ct
- 3216 River Bend Dr
Your Personal Tour Guide
Ask me questions while you tour the home.