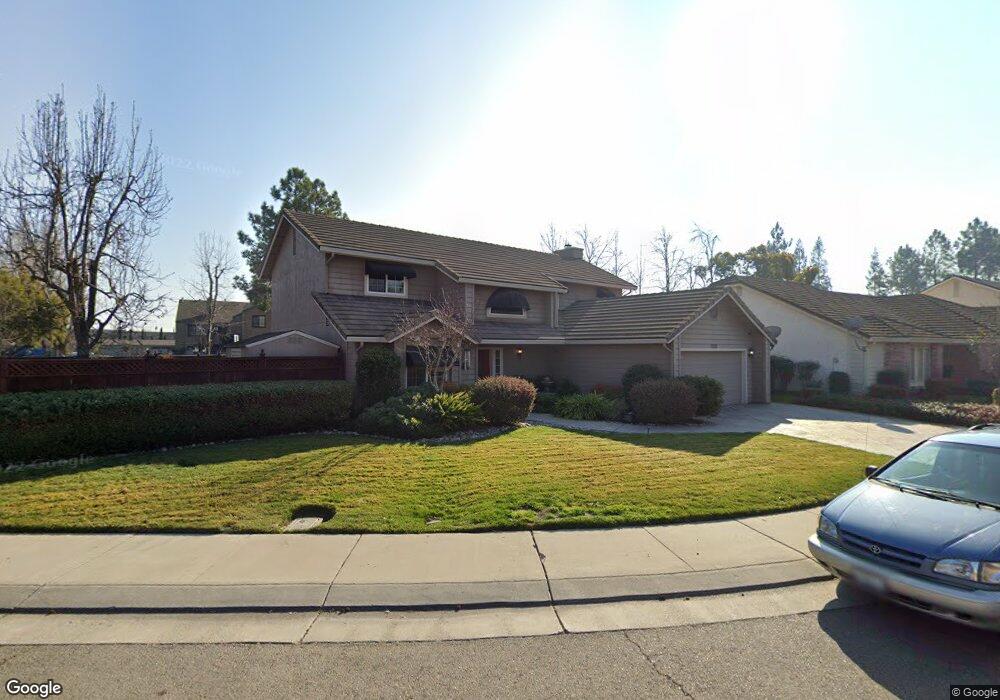
3232 Shoreline Ct Stockton, CA 95219
Estimated Value: $558,538 - $586,000
3
Beds
3
Baths
2,287
Sq Ft
$248/Sq Ft
Est. Value
About This Home
This home is located at 3232 Shoreline Ct, Stockton, CA 95219 and is currently estimated at $567,635, approximately $248 per square foot. 3232 Shoreline Ct is a home located in San Joaquin County with nearby schools including John R. Williams School, Sierra Middle School, and Lincoln High School.
Ownership History
Date
Name
Owned For
Owner Type
Purchase Details
Closed on
May 27, 2009
Sold by
Garibaldi Shari L
Bought by
Garibaldi Shari L and Garibaldi 2008 Revocab Shari L
Current Estimated Value
Purchase Details
Closed on
Oct 10, 2005
Sold by
Garibaldi Shari L and Garibaldi David J
Bought by
Garibaldi Shari L
Purchase Details
Closed on
Mar 8, 2001
Sold by
Allen Shari L and Garibaldi David J
Bought by
Garibaldi David J and Garibaldi Shari J
Home Financials for this Owner
Home Financials are based on the most recent Mortgage that was taken out on this home.
Original Mortgage
$125,000
Interest Rate
7.11%
Purchase Details
Closed on
Mar 13, 1998
Sold by
Shari Allen
Bought by
Allen Shari L and Garibaldi David J
Home Financials for this Owner
Home Financials are based on the most recent Mortgage that was taken out on this home.
Original Mortgage
$27,000
Interest Rate
7%
Purchase Details
Closed on
Apr 25, 1996
Sold by
Michael Allen
Bought by
Allen Shari L
Create a Home Valuation Report for This Property
The Home Valuation Report is an in-depth analysis detailing your home's value as well as a comparison with similar homes in the area
Home Values in the Area
Average Home Value in this Area
Purchase History
| Date | Buyer | Sale Price | Title Company |
|---|---|---|---|
| Garibaldi Shari L | -- | None Available | |
| Garibaldi Shari L | -- | -- | |
| Garibaldi David J | -- | First American Title Co | |
| Allen Shari L | -- | -- | |
| Allen Shari L | -- | -- |
Source: Public Records
Mortgage History
| Date | Status | Borrower | Loan Amount |
|---|---|---|---|
| Closed | Garibaldi David J | $125,000 | |
| Closed | Allen Shari L | $27,000 |
Source: Public Records
Tax History Compared to Growth
Tax History
| Year | Tax Paid | Tax Assessment Tax Assessment Total Assessment is a certain percentage of the fair market value that is determined by local assessors to be the total taxable value of land and additions on the property. | Land | Improvement |
|---|---|---|---|---|
| 2025 | $3,238 | $263,577 | $87,858 | $175,719 |
| 2024 | $3,170 | $258,410 | $86,136 | $172,274 |
| 2023 | $6,532 | $560,300 | $165,000 | $395,300 |
| 2022 | $2,936 | $248,306 | $82,767 | $165,539 |
| 2021 | $2,897 | $243,439 | $81,145 | $162,294 |
| 2020 | $2,896 | $240,943 | $80,313 | $160,630 |
| 2019 | $2,850 | $236,220 | $78,739 | $157,481 |
| 2018 | $2,798 | $231,590 | $77,196 | $154,394 |
| 2017 | $2,741 | $227,050 | $75,683 | $151,367 |
| 2016 | $2,712 | $222,599 | $74,200 | $148,399 |
| 2014 | $2,648 | $214,962 | $71,654 | $143,308 |
Source: Public Records
Map
Nearby Homes
- 3265 Shoreline Ct
- 3256 Lakeshore Ct
- 7303 Southfield Way
- 7348 Lighthouse Dr
- 7011 Shoreham Place
- 7513 Richland Way
- 7626 Richland Way
- 2737 Birch Ave
- 6845 Shiloh Ct
- 6827 Shiloh Ct
- 2653 Jasmine Ave
- 2618 Buttonwillow Ave
- 3790 Hatchers Cir
- 2708 Madrone Ave
- 2513 Hazelwood Ave
- 8116 Montgomery Ave
- 6724 Plymouth Rd Unit 44
- 6724 Plymouth Rd Unit 54
- 8356 Yarmouth Dr
- 8360 Norfolk Way
- 3264 Shoreline Ct
- 3233 Shoreline Ct
- 7139 Shoreline Dr
- 3287 Shoreline Ct
- 7211 Shoreline Dr
- 3245 Schooner Dr
- 7107 Shoreline Dr
- 7204 Shoreline Dr
- 3267 Schooner Dr
- 3309 Schooner Dr
- 7245 Shoreline Dr
- 7100 Shoreline Dr
- 3315 Schooner Dr
- 3321 Schooner Dr
- 7255 Shoreline Dr
- 3327 Schooner Dr
- 3345 Schooner Dr
- 3304 Schooner Dr
- 7164 Schooner Ct
- 7307 Shoreline Dr