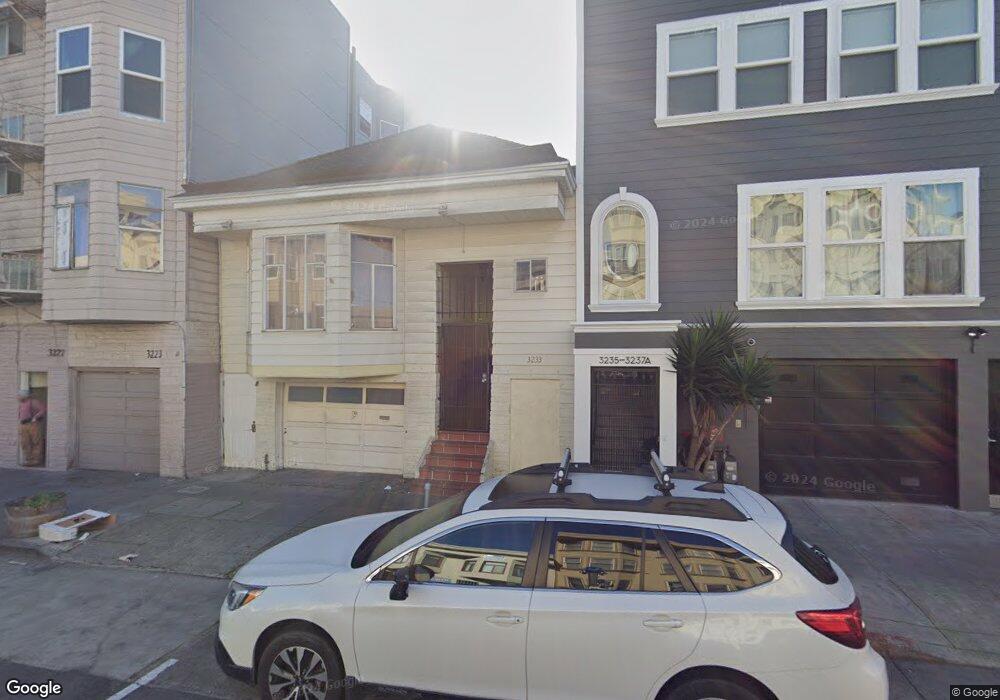
3233 17th St San Francisco, CA 94110
Inner Mission NeighborhoodEstimated Value: $1,154,000 - $1,597,417
2
Beds
1
Bath
975
Sq Ft
$1,422/Sq Ft
Est. Value
About This Home
This home is located at 3233 17th St, San Francisco, CA 94110 and is currently estimated at $1,386,854, approximately $1,422 per square foot. 3233 17th St is a home located in San Francisco County with nearby schools including George Moscone Elementary, Hoover (Herbert) Middle School, and La Scuola International School Elementary School Campus.
Ownership History
Date
Name
Owned For
Owner Type
Purchase Details
Closed on
Nov 26, 2005
Sold by
Troxell Christopher
Bought by
Acharya Suraj
Current Estimated Value
Home Financials for this Owner
Home Financials are based on the most recent Mortgage that was taken out on this home.
Original Mortgage
$542,400
Outstanding Balance
$302,755
Interest Rate
6.25%
Mortgage Type
Purchase Money Mortgage
Estimated Equity
$1,084,099
Purchase Details
Closed on
Nov 22, 2005
Sold by
Acharya Suraj
Bought by
Acharya Suraj and Bhalla Shalini
Home Financials for this Owner
Home Financials are based on the most recent Mortgage that was taken out on this home.
Original Mortgage
$542,400
Outstanding Balance
$302,755
Interest Rate
6.25%
Mortgage Type
Purchase Money Mortgage
Estimated Equity
$1,084,099
Create a Home Valuation Report for This Property
The Home Valuation Report is an in-depth analysis detailing your home's value as well as a comparison with similar homes in the area
Home Values in the Area
Average Home Value in this Area
Purchase History
| Date | Buyer | Sale Price | Title Company |
|---|---|---|---|
| Acharya Suraj | $678,500 | Fidelity National Title Co | |
| Acharya Suraj | -- | Fidelity National Title Co | |
| Acharya Suraj | -- | Fidelity National Title Co |
Source: Public Records
Mortgage History
| Date | Status | Borrower | Loan Amount |
|---|---|---|---|
| Open | Acharya Suraj | $542,400 | |
| Closed | Acharya Suraj | $67,750 |
Source: Public Records
Tax History
| Year | Tax Paid | Tax Assessment Tax Assessment Total Assessment is a certain percentage of the fair market value that is determined by local assessors to be the total taxable value of land and additions on the property. | Land | Improvement |
|---|---|---|---|---|
| 2025 | $11,348 | $926,508 | $751,604 | $174,904 |
| 2024 | $11,348 | $908,344 | $736,868 | $171,476 |
| 2023 | $11,171 | $890,534 | $722,420 | $168,114 |
| 2022 | $10,950 | $873,074 | $708,256 | $164,818 |
| 2021 | $10,752 | $855,958 | $694,370 | $161,588 |
| 2020 | $10,809 | $847,184 | $687,252 | $159,932 |
| 2019 | $10,440 | $830,576 | $673,778 | $156,798 |
| 2018 | $10,087 | $814,292 | $660,568 | $153,724 |
| 2017 | $9,669 | $798,326 | $647,616 | $150,710 |
| 2016 | $9,499 | $782,674 | $634,918 | $147,756 |
| 2015 | $9,379 | $770,920 | $625,382 | $145,538 |
| 2014 | $9,132 | $755,820 | $613,132 | $142,688 |
Source: Public Records
Map
Nearby Homes
- 308 Shotwell St Unit 2
- 25 Sycamore St
- 88 Hoff St Unit 104
- 88 Hoff St Unit 101
- 2132 Folsom St Unit 3
- 471 S Van Ness Ave
- 1515 15th St Unit 401
- 1515 15th St Unit 501
- 1930 Mission St Unit 105
- 1397 Minna St
- 1383 Natoma St Unit 1385
- 1875 Mission St Unit 304
- 108 Albion St Unit A
- 1349 Minna
- 49 Albion St Unit A
- 241 14th St
- 3545 20th St
- 317 San Carlos St
- 626 Shotwell St
- 3579 19th St
- 3237 17th St
- 3237 17th St
- 3235 17th St
- 3239 17th St
- 3219 17th St
- 3249 17th St Unit 3
- 3249 17th St Unit 2
- 3249 17th St Unit 1
- 3249 17th St
- 231 Capp St Unit 233
- 600 S Van Ness Ave
- 620 S Van Ness Ave
- 620 S Van Ness Ave
- 620 S Van Ness Ave
- 3228 17th St
- 630 S Van Ness Ave Unit 632
- 237 Capp St Unit 239
- 3226 17th St
- 3236 17th St Unit 2
- 3236 17th St Unit 3
Your Personal Tour Guide
Ask me questions while you tour the home.