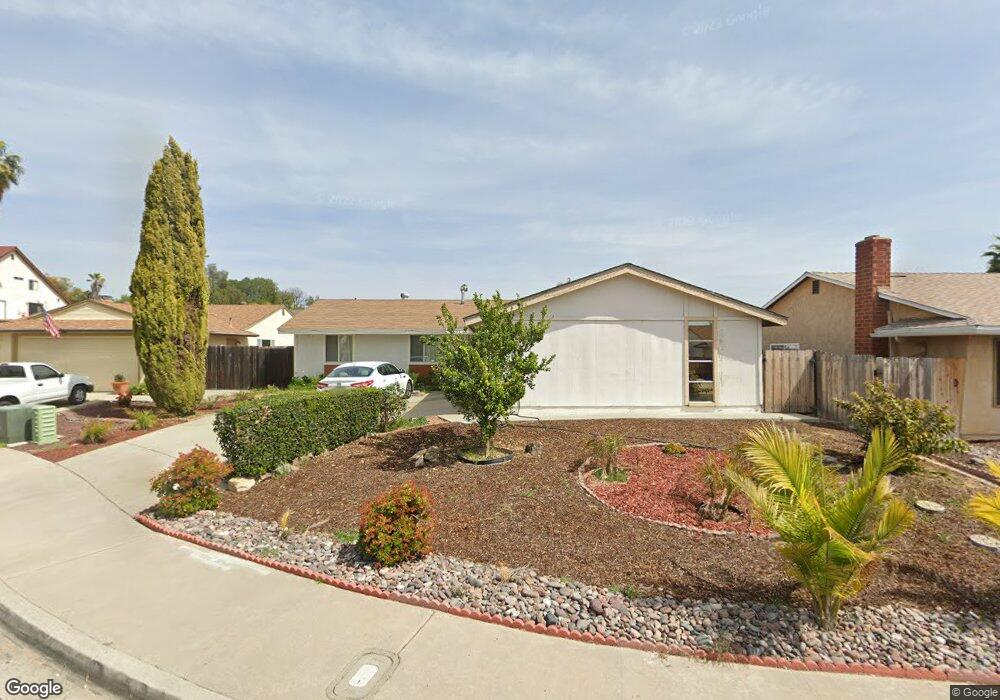
3233 Lemon Ln Lemon Grove, CA 91945
Estimated Value: $759,000 - $846,000
4
Beds
2
Baths
1,296
Sq Ft
$619/Sq Ft
Est. Value
About This Home
This home is located at 3233 Lemon Ln, Lemon Grove, CA 91945 and is currently estimated at $801,802, approximately $618 per square foot. 3233 Lemon Ln is a home located in San Diego County with nearby schools including Lemon Grove Academy Middle, Mount Miguel High School, and Sparrow Academy.
Ownership History
Date
Name
Owned For
Owner Type
Purchase Details
Closed on
Jan 29, 2001
Sold by
Fuentes Jorge and Fuentes Patricia
Bought by
Webea Simagne
Current Estimated Value
Home Financials for this Owner
Home Financials are based on the most recent Mortgage that was taken out on this home.
Original Mortgage
$23,000
Outstanding Balance
$8,344
Interest Rate
6.97%
Mortgage Type
Unknown
Estimated Equity
$793,458
Purchase Details
Closed on
Dec 7, 1998
Sold by
Heimer Joseph P and Heimer Virginia E
Bought by
Fuentes Jorge and Fuentes Patricia
Home Financials for this Owner
Home Financials are based on the most recent Mortgage that was taken out on this home.
Original Mortgage
$161,667
Interest Rate
6.63%
Mortgage Type
FHA
Purchase Details
Closed on
Oct 31, 1997
Sold by
Heimer Joseph P and Heimer Virginia E
Bought by
Heimer Joseph P and Heimer Virginia E
Purchase Details
Closed on
Dec 3, 1985
Create a Home Valuation Report for This Property
The Home Valuation Report is an in-depth analysis detailing your home's value as well as a comparison with similar homes in the area
Home Values in the Area
Average Home Value in this Area
Purchase History
| Date | Buyer | Sale Price | Title Company |
|---|---|---|---|
| Webea Simagne | $230,000 | Lawyers Title | |
| Fuentes Jorge | $163,000 | Chicago Title Co | |
| Heimer Joseph P | -- | -- | |
| -- | $105,000 | -- |
Source: Public Records
Mortgage History
| Date | Status | Borrower | Loan Amount |
|---|---|---|---|
| Open | Webea Simagne | $23,000 | |
| Previous Owner | Webea Simagne | $184,000 | |
| Previous Owner | Fuentes Jorge | $161,667 |
Source: Public Records
Tax History
| Year | Tax Paid | Tax Assessment Tax Assessment Total Assessment is a certain percentage of the fair market value that is determined by local assessors to be the total taxable value of land and additions on the property. | Land | Improvement |
|---|---|---|---|---|
| 2025 | $4,689 | $346,551 | $165,742 | $180,809 |
| 2024 | $4,689 | $339,757 | $162,493 | $177,264 |
| 2023 | $4,573 | $333,096 | $159,307 | $173,789 |
| 2022 | $4,548 | $326,566 | $156,184 | $170,382 |
| 2021 | $4,488 | $320,164 | $153,122 | $167,042 |
| 2020 | $4,435 | $316,882 | $151,552 | $165,330 |
| 2019 | $4,363 | $310,670 | $148,581 | $162,089 |
| 2018 | $4,264 | $304,579 | $145,668 | $158,911 |
| 2017 | $150 | $298,608 | $142,812 | $155,796 |
| 2016 | $4,049 | $292,754 | $140,012 | $152,742 |
| 2015 | $4,024 | $288,357 | $137,909 | $150,448 |
| 2014 | $3,869 | $282,709 | $135,208 | $147,501 |
Source: Public Records
Map
Nearby Homes
- 8192 Golden Ave
- 8190 Golden Ave
- 8188 Golden Ave
- 8186 Golden Ave
- 8180 Golden Ave
- 8184 Golden Ave
- 8182 Golden Ave
- 8176 Golden Ave
- 8178 Golden Ave
- 8164 Golden Ave
- 8172 Golden Ave
- 8160 Golden Ave
- 8156 Golden Ave
- 3422 Trophy Dr
- 3355 Par Dr
- 3443 Trophy Dr
- 3448 Trophy Dr
- 3451 Fairway Dr
- 8186 Lemon Grove Way Unit E
- 8146 Lemon Grove Way Unit B
Your Personal Tour Guide
Ask me questions while you tour the home.