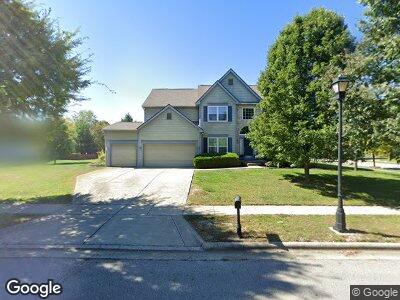
3233 Walkerview Dr Hilliard, OH 43026
Estimated Value: $542,681 - $604,000
4
Beds
3
Baths
2,668
Sq Ft
$219/Sq Ft
Est. Value
About This Home
This home is located at 3233 Walkerview Dr, Hilliard, OH 43026 and is currently estimated at $583,170, approximately $218 per square foot. 3233 Walkerview Dr is a home located in Franklin County with nearby schools including Hilliard Station Sixth Grade Elementary School, Hilliard Memorial Middle School, and Hilliard Bradley High School.
Ownership History
Date
Name
Owned For
Owner Type
Purchase Details
Closed on
Jan 30, 2007
Sold by
Patel Bhupendra and Patel Anjana B
Bought by
Bonaventura Dean Michael M and Bonaventura Dean Stephaine
Current Estimated Value
Home Financials for this Owner
Home Financials are based on the most recent Mortgage that was taken out on this home.
Original Mortgage
$224,000
Interest Rate
6.27%
Mortgage Type
Purchase Money Mortgage
Purchase Details
Closed on
Aug 16, 2004
Sold by
Homewood Corp
Bought by
Patel Bhupendra and Patel Bhupendra T
Home Financials for this Owner
Home Financials are based on the most recent Mortgage that was taken out on this home.
Original Mortgage
$160,000
Interest Rate
3.75%
Mortgage Type
Purchase Money Mortgage
Purchase Details
Closed on
Feb 26, 2003
Sold by
Ad Creek Llc
Bought by
Homewood Corp
Create a Home Valuation Report for This Property
The Home Valuation Report is an in-depth analysis detailing your home's value as well as a comparison with similar homes in the area
Home Values in the Area
Average Home Value in this Area
Purchase History
| Date | Buyer | Sale Price | Title Company |
|---|---|---|---|
| Bonaventura Dean Michael M | $280,000 | Chicago Tit | |
| Patel Bhupendra | $317,100 | -- | |
| Homewood Corp | -- | -- |
Source: Public Records
Mortgage History
| Date | Status | Borrower | Loan Amount |
|---|---|---|---|
| Open | Dean Michael M | $174,700 | |
| Closed | Dean Michael M | $100,000 | |
| Open | Dean Michael M | $298,000 | |
| Closed | Dean Michael M | $35,900 | |
| Closed | Dean Michael M | $260,000 | |
| Closed | Bonaventura Dean Michael D | $50,000 | |
| Closed | Dean Michael M | $221,000 | |
| Closed | Dean Michael M | $22,000 | |
| Closed | Dean Michael M | $227,600 | |
| Closed | Bonaventura Dean Michael M | $224,000 | |
| Closed | Patel Bhupendra | $100,000 | |
| Previous Owner | Patel Bhupendra | $160,000 |
Source: Public Records
Tax History Compared to Growth
Tax History
| Year | Tax Paid | Tax Assessment Tax Assessment Total Assessment is a certain percentage of the fair market value that is determined by local assessors to be the total taxable value of land and additions on the property. | Land | Improvement |
|---|---|---|---|---|
| 2024 | $10,353 | $154,560 | $45,500 | $109,060 |
| 2023 | $8,430 | $154,560 | $45,500 | $109,060 |
| 2022 | $8,623 | $125,830 | $27,300 | $98,530 |
| 2021 | $8,618 | $125,830 | $27,300 | $98,530 |
| 2020 | $8,596 | $125,830 | $27,300 | $98,530 |
| 2019 | $8,338 | $103,880 | $22,750 | $81,130 |
| 2018 | $8,316 | $103,880 | $22,750 | $81,130 |
| 2017 | $8,307 | $103,880 | $22,750 | $81,130 |
| 2016 | $8,814 | $102,030 | $27,230 | $74,800 |
| 2015 | $8,324 | $102,030 | $27,230 | $74,800 |
| 2014 | $8,339 | $102,030 | $27,230 | $74,800 |
| 2013 | $4,325 | $104,300 | $27,230 | $77,070 |
Source: Public Records
Map
Nearby Homes
- 6038 Hampton Corners N
- 3308 Vinton Park Place
- 3209 Cassey St
- 3161 Cassey St
- 5952 Hampton Corners S
- 6008 MacNabb Ct
- 2878 Quailview Ln
- 6540 Marshview Dr
- 6601 Marshview Dr
- 6251 Freewood Dr
- 2725 Westrock Dr
- 5619 Chapman Ct
- 3596 Sparrow Ct
- 2643 Westrock Dr
- 6134 Glade Run Rd
- 2632 Westrock Dr
- 6600 Davis Rd
- 6580 Davis Rd
- 3961 Hill Park Rd Unit 3961
- 2744 Brittany Oaks Blvd
- 3233 Walkerview Dr
- 3225 Walkerview Dr
- 3232 Benbrook Pond Dr
- 3249 Walkerview Dr
- 3234 Walkerview Dr
- 3224 Benbrook Pond Dr
- 3226 Walkerview Dr
- 3248 Benbrook Pond Dr
- 3217 Walkerview Dr
- 3250 Walkerview Dr
- 3257 Walker View Dr
- 3257 Walkerview Dr
- 3216 Benbrook Pond Dr
- 3256 Benbrook Pond Dr
- 3235 Vinton Park Place
- 3231 Benbrook Pond Dr
- 3258 Walkerview Dr
- 3243 Vinton Park Place
- 3227 Vinton Park Place
- 3209 Walkerview Dr