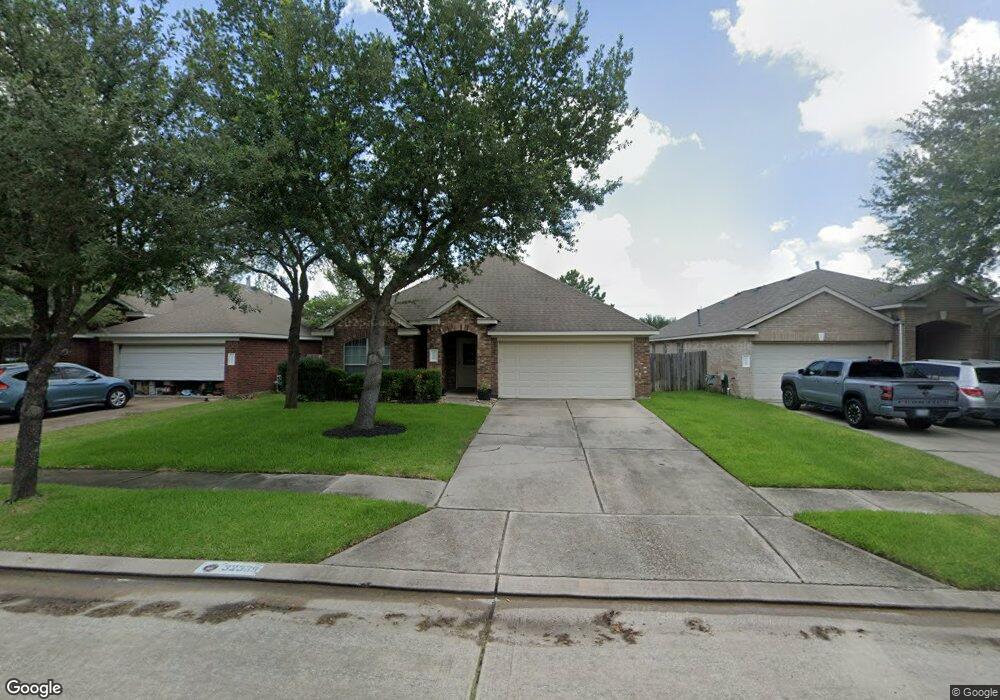
32339 Cross Spring Park Ln Conroe, TX 77385
Imperial Oaks NeighborhoodEstimated Value: $279,000 - $291,000
--
Bed
--
Bath
1,870
Sq Ft
$153/Sq Ft
Est. Value
About This Home
This home is located at 32339 Cross Spring Park Ln, Conroe, TX 77385 and is currently estimated at $286,456, approximately $153 per square foot. 32339 Cross Spring Park Ln is a home located in Montgomery County with nearby schools including Kaufman Elementary School, Vogel Intermediate School, and Irons J High School.
Ownership History
Date
Name
Owned For
Owner Type
Purchase Details
Closed on
Jun 18, 2008
Sold by
Black Aaron and Black Angela D
Bought by
Bushek Nicholas M and Bushek Toni A
Current Estimated Value
Home Financials for this Owner
Home Financials are based on the most recent Mortgage that was taken out on this home.
Original Mortgage
$147,719
Outstanding Balance
$94,524
Interest Rate
6.08%
Mortgage Type
VA
Estimated Equity
$191,932
Purchase Details
Closed on
Jun 17, 2005
Sold by
D R Horton Emerald Ltd
Bought by
Black Aaron and Black Angela D
Home Financials for this Owner
Home Financials are based on the most recent Mortgage that was taken out on this home.
Original Mortgage
$25,000
Interest Rate
5.67%
Mortgage Type
Unknown
Purchase Details
Closed on
Oct 6, 2003
Sold by
Imperial Oaks No 3 Ltd
Bought by
Bushek Nicholas M and Bushek Toni A
Create a Home Valuation Report for This Property
The Home Valuation Report is an in-depth analysis detailing your home's value as well as a comparison with similar homes in the area
Home Values in the Area
Average Home Value in this Area
Purchase History
| Date | Buyer | Sale Price | Title Company |
|---|---|---|---|
| Bushek Nicholas M | -- | Chicago Title | |
| Black Aaron | -- | Dhi Title | |
| Bushek Nicholas M | -- | -- |
Source: Public Records
Mortgage History
| Date | Status | Borrower | Loan Amount |
|---|---|---|---|
| Open | Bushek Nicholas M | $147,719 | |
| Previous Owner | Black Aaron | $25,000 | |
| Previous Owner | Black Aaron | $104,990 |
Source: Public Records
Tax History Compared to Growth
Tax History
| Year | Tax Paid | Tax Assessment Tax Assessment Total Assessment is a certain percentage of the fair market value that is determined by local assessors to be the total taxable value of land and additions on the property. | Land | Improvement |
|---|---|---|---|---|
| 2025 | $4,969 | $295,392 | $50,000 | $245,392 |
| 2024 | $4,541 | $277,420 | -- | -- |
| 2023 | $4,541 | $252,200 | $50,000 | $243,630 |
| 2022 | $5,858 | $229,270 | $23,500 | $241,610 |
| 2021 | $5,758 | $208,430 | $23,500 | $184,930 |
| 2020 | $5,653 | $196,010 | $23,500 | $172,510 |
| 2019 | $5,836 | $196,860 | $23,500 | $175,690 |
| 2018 | $4,682 | $178,960 | $23,500 | $155,460 |
| 2017 | $5,435 | $182,270 | $23,500 | $158,770 |
| 2016 | $5,281 | $177,110 | $23,500 | $153,610 |
| 2015 | $4,362 | $167,850 | $23,500 | $153,610 |
| 2014 | $4,362 | $152,590 | $23,500 | $129,090 |
Source: Public Records
Map
Nearby Homes
- 31602 Forest Oak Park Ct
- 32315 Golden Oak Park Ln
- 32331 Summer Park Ln
- 2526 Hidden Park Ln
- 31419 Fountainbrook Park Ln
- 2614 Winding Creek Way
- 2611 Winding Creek Way
- 31815 Forest Oak Ln
- 32319 Archer Park
- 31810 Forest Oak Ln
- 31235 Windcrest Park Ln
- 2707 Oak Pass Ct
- 31214 Windcrest Park Ln
- 2643 Imperial Grove Ln
- 2898 Woodland Glen Ln
- 31903 Burnt Wood Ct
- 2611 Cedar Path Ln
- 2618 Bridgestone Park Ln
- 2610 Cedar Path Ln
- 2623 Cedar Path Ln
- 32343 Cross Spring Park Ln
- 32335 Cross Spring Park Ln
- 32331 Cross Spring Park Ln
- 32342 Cross Spring Park Ln
- 32338 Cross Spring Park Ln
- 32403 Cross Spring Park Ln
- 32346 Cross Spring Park Ln
- 32334 Cross Spring Park Ln
- 32323 Cross Spring Park Ln
- 32350 Cross Spring Park Ln
- 32330 Cross Spring Park Ln
- 32407 Cross Spring Park Ln
- 32402 Cross Spring Park Ln
- 31707 Forest Oak Park Ct
- 31703 Forest Oak Park Ct
- 32326 Cross Spring Park Ln
- 32319 Cross Spring Park Ln
- 31711 Forest Oak Park Ct
- 32406 Cross Spring Park Ln
- 31715 Forest Oak Park Ct