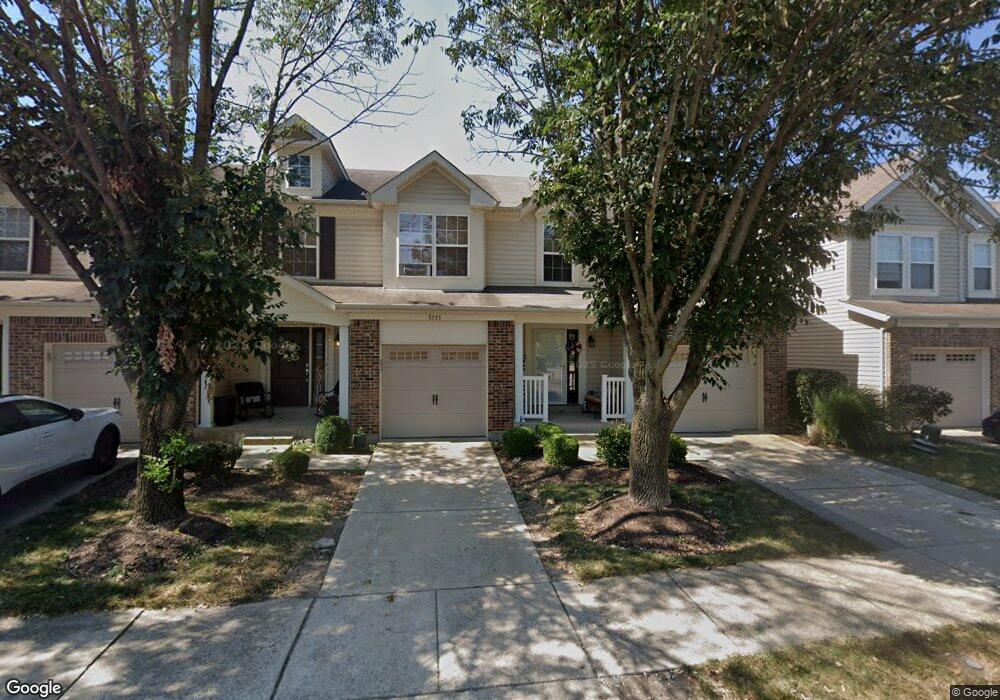
3235 Cog Wheel Station Saint Charles, MO 63301
New Town NeighborhoodEstimated Value: $236,766 - $249,000
3
Beds
2
Baths
1,344
Sq Ft
$181/Sq Ft
Est. Value
About This Home
This home is located at 3235 Cog Wheel Station, Saint Charles, MO 63301 and is currently estimated at $243,442, approximately $181 per square foot. 3235 Cog Wheel Station is a home located in St. Charles County with nearby schools including Discovery Elementary School, Orchard Farm Elementary School, and Orchard Farm Middle School.
Ownership History
Date
Name
Owned For
Owner Type
Purchase Details
Closed on
Sep 6, 2018
Sold by
Cvre Llc
Bought by
Cv Ramona Llc
Current Estimated Value
Purchase Details
Closed on
Sep 21, 2009
Sold by
Pulaski Bank
Bought by
Youngblood Robert P and Youngblood Judy A
Home Financials for this Owner
Home Financials are based on the most recent Mortgage that was taken out on this home.
Original Mortgage
$98,400
Interest Rate
5.36%
Mortgage Type
New Conventional
Purchase Details
Closed on
Aug 10, 2009
Sold by
Ormsby Reagan
Bought by
Pulaski Bank
Home Financials for this Owner
Home Financials are based on the most recent Mortgage that was taken out on this home.
Original Mortgage
$98,400
Interest Rate
5.36%
Mortgage Type
New Conventional
Purchase Details
Closed on
Nov 17, 2006
Sold by
Fischer & Frichtel Inc
Bought by
Ormsby Reagan
Home Financials for this Owner
Home Financials are based on the most recent Mortgage that was taken out on this home.
Original Mortgage
$134,671
Interest Rate
7.37%
Mortgage Type
Purchase Money Mortgage
Create a Home Valuation Report for This Property
The Home Valuation Report is an in-depth analysis detailing your home's value as well as a comparison with similar homes in the area
Home Values in the Area
Average Home Value in this Area
Purchase History
We collect this data history from publicly available records. To have your information removed, we recommend requesting removal directly through your county’s website.
| Date | Buyer | Sale Price | Title Company |
|---|---|---|---|
| Cv Ramona Llc | -- | None Available | |
| Youngblood Robert P | $123,000 | Pulaski Title Company | |
| Pulaski Bank | -- | Pulaski Title Company | |
| Ormsby Reagan | -- | None Available |
Source: Public Records
Mortgage History
We collect this data history from publicly available records. To have your information removed, we recommend requesting removal directly through your county’s website.
| Date | Status | Borrower | Loan Amount |
|---|---|---|---|
| Previous Owner | Youngblood Robert P | $98,400 | |
| Previous Owner | Ormsby Reagan | $134,671 |
Source: Public Records
Tax History
| Year | Tax Paid | Tax Assessment Tax Assessment Total Assessment is a certain percentage of the fair market value that is determined by local assessors to be the total taxable value of land and additions on the property. | Land | Improvement |
|---|---|---|---|---|
| 2025 | $2,589 | $43,780 | -- | -- |
| 2023 | $2,590 | $38,397 | -- | -- |
| 2022 | $2,198 | $31,357 | $0 | $0 |
| 2021 | $2,201 | $31,357 | $0 | $0 |
| 2020 | $1,984 | $27,954 | $0 | $0 |
| 2019 | $1,798 | $27,954 | $0 | $0 |
| 2018 | $1,628 | $24,147 | $0 | $0 |
| 2017 | $1,603 | $24,147 | $0 | $0 |
| 2016 | $1,515 | $22,196 | $0 | $0 |
| 2015 | $1,527 | $22,196 | $0 | $0 |
| 2014 | $1,478 | $21,010 | $0 | $0 |
Source: Public Records
Map
Nearby Homes
- 3251 Cog Wheel Station
- 3125 Calhoun Dr
- 3120 Cog Wheel Station
- 235 Crestfield Ct
- 3329 Charlestowne Crossing Dr
- 1604 Tamarack Dr
- 3424 Charlestowne Crossing Dr
- 3207 Stowe Landing
- 3448 Charlestowne Crossing Dr
- 3128 Kister Dr
- 3456 Harbor Crossing Dr
- 3337 Carriage Crossing
- 3421 E Lime Kiln
- 3416 Hiram St Unit B2
- 3055 Devilla Trail Unit 8B
- 338 Becks Landing Place
- 237 E Arpent Way
- 5085 Barter St
- 1128 Black Forest Dr
- 5026 Becks Landing Ln
- 3227 Cog Wheel Station
- 3221 Cog Wheel Station
- 3221 Cog Wheel Station Unit 34
- 3231 Cog Wheel Station
- 3219 Cog Wheel Station
- 3219 Cog Wheel Station Unit 33
- 3233 Cog Wheel Station
- 3217 Cog Wheel Station
- 3217 Cog Wheel Station Unit 32
- 3215 Cog Wheel Station
- 3180 Calhoun Dr
- 3184 Calhoun Dr
- 3184 Calhoun Dr Unit Lot 46B
- 3101 Keelboat Xng
- 3100 Railcar Bend
- 3239 Cog Wheel Station
- 3211 Cog Wheel Station
- 3211 Cog Wheel Station Unit 30
- 3176 Calhoun Dr
- 3188 Calhoun Dr
Your Personal Tour Guide
Ask me questions while you tour the home.