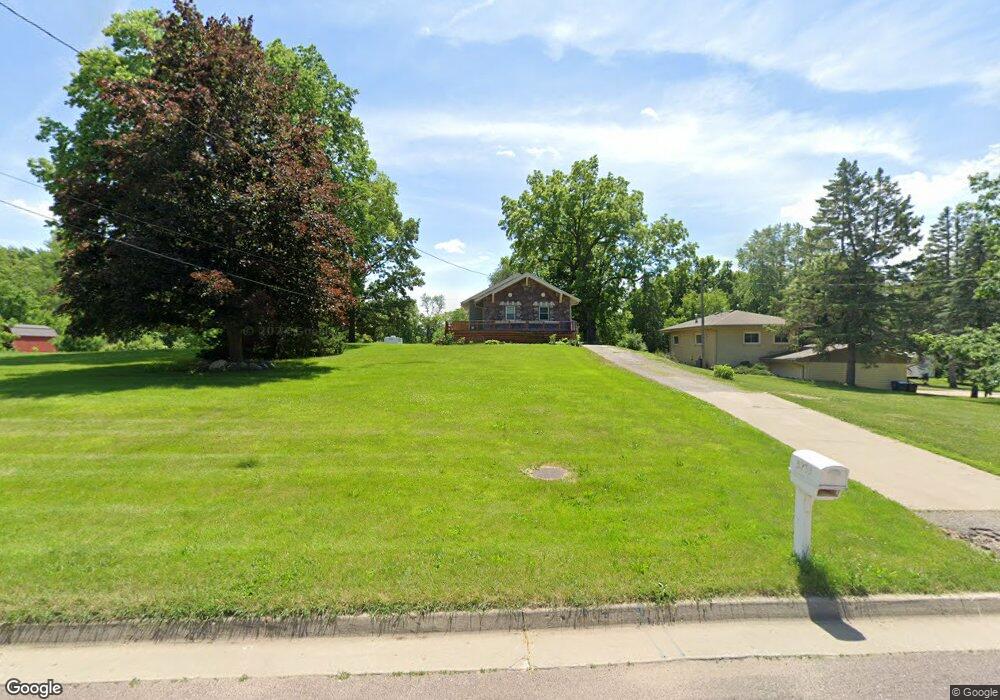
3235 E Shawnee Ave Des Moines, IA 50317
Douglas Acres NeighborhoodEstimated Value: $184,000 - $230,461
3
Beds
1
Bath
1,072
Sq Ft
$203/Sq Ft
Est. Value
About This Home
This home is located at 3235 E Shawnee Ave, Des Moines, IA 50317 and is currently estimated at $217,115, approximately $202 per square foot. 3235 E Shawnee Ave is a home located in Polk County with nearby schools including Garton Elementary School, Goodrell Middle School, and North High School.
Ownership History
Date
Name
Owned For
Owner Type
Purchase Details
Closed on
Jul 16, 2021
Sold by
Mcelfish Mason D and Mcelfish Lindsay Jo
Bought by
Mcelfish Mason D and Mcelfish Lindsay Jo
Current Estimated Value
Home Financials for this Owner
Home Financials are based on the most recent Mortgage that was taken out on this home.
Original Mortgage
$135,000
Outstanding Balance
$103,289
Interest Rate
2.96%
Mortgage Type
New Conventional
Estimated Equity
$113,826
Purchase Details
Closed on
Sep 19, 2008
Sold by
Cleland Dorothy
Bought by
Mcelfish Mason
Home Financials for this Owner
Home Financials are based on the most recent Mortgage that was taken out on this home.
Original Mortgage
$93,003
Interest Rate
6.43%
Mortgage Type
FHA
Purchase Details
Closed on
Jun 17, 2004
Sold by
Graves Bill
Bought by
Graves Kimber L and Mc Candless Dianna L
Create a Home Valuation Report for This Property
The Home Valuation Report is an in-depth analysis detailing your home's value as well as a comparison with similar homes in the area
Home Values in the Area
Average Home Value in this Area
Purchase History
| Date | Buyer | Sale Price | Title Company |
|---|---|---|---|
| Mcelfish Mason D | -- | None Available | |
| Mcelfish Mason | $93,500 | None Available | |
| Graves Kimber L | -- | None Available |
Source: Public Records
Mortgage History
| Date | Status | Borrower | Loan Amount |
|---|---|---|---|
| Open | Mcelfish Mason D | $135,000 | |
| Closed | Mcelfish Mason | $93,003 |
Source: Public Records
Tax History
| Year | Tax Paid | Tax Assessment Tax Assessment Total Assessment is a certain percentage of the fair market value that is determined by local assessors to be the total taxable value of land and additions on the property. | Land | Improvement |
|---|---|---|---|---|
| 2025 | $3,528 | $217,700 | $48,200 | $169,500 |
| 2024 | $3,528 | $179,300 | $44,200 | $135,100 |
| 2023 | $3,456 | $202,300 | $44,200 | $158,100 |
| 2022 | $3,428 | $169,600 | $38,900 | $130,700 |
| 2021 | $3,332 | $169,600 | $38,900 | $130,700 |
| 2020 | $3,460 | $156,500 | $35,800 | $120,700 |
| 2019 | $3,190 | $156,500 | $35,800 | $120,700 |
| 2018 | $3,158 | $118,700 | $30,500 | $88,200 |
| 2017 | $2,946 | $118,700 | $30,500 | $88,200 |
| 2016 | $2,870 | $108,900 | $27,600 | $81,300 |
| 2015 | $2,870 | $108,900 | $27,600 | $81,300 |
| 2014 | $2,630 | $99,000 | $24,600 | $74,400 |
Source: Public Records
Map
Nearby Homes
- 3008 E Shawnee Ave
- 4147 E 29th St
- 3111 E Clinton Ave
- 3101 E Clinton Ave
- 3811 E 29th St
- 3924 & 3926 E 38th St
- 2814 E Douglas Ave
- 2816 NE Norwood Ln
- 2776 NE Norwood Ln
- 4128 E 27th St
- 3827 E 27th St
- 3926 E 27th St
- 1408 E 38th St
- 000 E 38th St
- 4300 NE 27th St
- 2843 E 50th St
- 3922 E 26th St
- 3106 Roblang Ct
- 4102 E 25th St
- 3902 E 40th St
- 3227 E Shawnee Ave
- 3219 E Shawnee Ave
- 3255 E Shawnee Ave
- 3234 E Shawnee Ave
- 3230 E Shawnee Ave
- 3224 E Shawnee Ave
- 3256 E Shawnee Ave
- 3261 E Shawnee Ave
- 4025 E 32nd St
- 4035 E 32nd St
- 3248 E Shawnee Ave
- 4029 E 32nd St
- 4019 E 32nd St
- 4015 E 32nd St
- 4101 E 32nd St
- 4011 E 32nd St
- 3275 E Shawnee Ave
- 3266 E Shawnee Ave
- 4103 E 32nd St
- 4001 E 32nd St
Your Personal Tour Guide
Ask me questions while you tour the home.