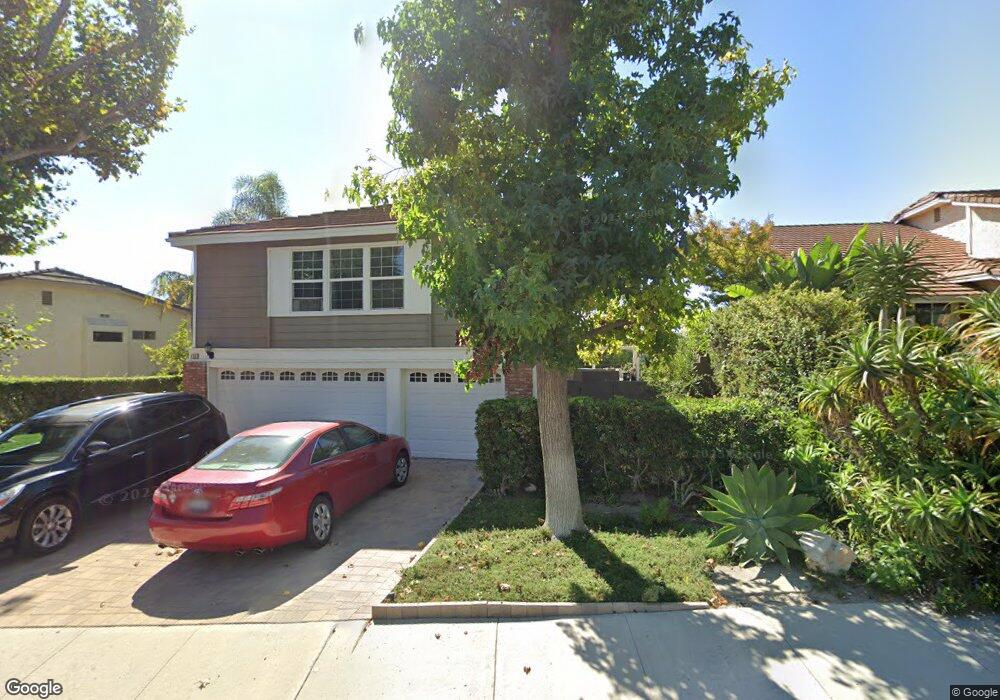
3235 Monte Carlo Dr Thousand Oaks, CA 91362
Estimated Value: $1,347,390 - $1,426,000
4
Beds
3
Baths
2,847
Sq Ft
$487/Sq Ft
Est. Value
About This Home
This home is located at 3235 Monte Carlo Dr, Thousand Oaks, CA 91362 and is currently estimated at $1,385,848, approximately $486 per square foot. 3235 Monte Carlo Dr is a home located in Ventura County with nearby schools including Lang Ranch, Los Cerritos Middle School, and Westlake High School.
Ownership History
Date
Name
Owned For
Owner Type
Purchase Details
Closed on
Mar 21, 2001
Sold by
Atkinson William F and Atkinson Darla D
Bought by
Briers David E and Briers Monica P
Current Estimated Value
Home Financials for this Owner
Home Financials are based on the most recent Mortgage that was taken out on this home.
Original Mortgage
$401,600
Outstanding Balance
$147,000
Interest Rate
7.09%
Estimated Equity
$1,238,848
Purchase Details
Closed on
Feb 9, 2000
Sold by
Pesceone Robert J and Pesceone Marcy J
Bought by
Patten Dennis R and Patten Vivian F
Home Financials for this Owner
Home Financials are based on the most recent Mortgage that was taken out on this home.
Original Mortgage
$394,000
Interest Rate
2.5%
Purchase Details
Closed on
Jan 25, 2000
Sold by
Patten Dennis R and Patten Vivian F
Bought by
Atkinson William F and Atkinson Darla D
Home Financials for this Owner
Home Financials are based on the most recent Mortgage that was taken out on this home.
Original Mortgage
$394,000
Interest Rate
2.5%
Create a Home Valuation Report for This Property
The Home Valuation Report is an in-depth analysis detailing your home's value as well as a comparison with similar homes in the area
Home Values in the Area
Average Home Value in this Area
Purchase History
| Date | Buyer | Sale Price | Title Company |
|---|---|---|---|
| Briers David E | $502,000 | American Title Co | |
| Patten Dennis R | -- | American Title Co | |
| Atkinson William F | $492,500 | American Title Co |
Source: Public Records
Mortgage History
| Date | Status | Borrower | Loan Amount |
|---|---|---|---|
| Open | Briers David E | $401,600 | |
| Previous Owner | Atkinson William F | $394,000 |
Source: Public Records
Tax History Compared to Growth
Tax History
| Year | Tax Paid | Tax Assessment Tax Assessment Total Assessment is a certain percentage of the fair market value that is determined by local assessors to be the total taxable value of land and additions on the property. | Land | Improvement |
|---|---|---|---|---|
| 2025 | $8,792 | $762,354 | $302,567 | $459,787 |
| 2024 | $8,792 | $747,406 | $296,634 | $450,772 |
| 2023 | $8,539 | $732,751 | $290,817 | $441,934 |
| 2022 | $8,376 | $718,384 | $285,115 | $433,269 |
| 2021 | $8,215 | $704,299 | $279,525 | $424,774 |
| 2020 | $7,749 | $697,078 | $276,659 | $420,419 |
| 2019 | $7,544 | $683,411 | $271,235 | $412,176 |
| 2018 | $7,389 | $670,012 | $265,917 | $404,095 |
| 2017 | $7,242 | $656,875 | $260,703 | $396,172 |
| 2016 | $7,169 | $643,996 | $255,592 | $388,404 |
| 2015 | $7,042 | $634,324 | $251,753 | $382,571 |
| 2014 | $6,938 | $621,900 | $246,822 | $375,078 |
Source: Public Records
Map
Nearby Homes
- 3225 Futura Point
- 2217 Laurelwood Dr
- 3128 Casino Dr
- 2347 Laurelwood Dr
- 3249 Springbrook St
- 2906 Evesham Ave
- 2427 Springbrook St
- 3375 Montagne Way
- 2499 Springbrook St
- 1915 Woodside Dr
- 2848 Bayham Cir
- 2001 Brookfield Dr
- 3822 Sunset Knolls Dr
- 1681 Calle de Oro
- 1662 Calle Rochelle
- 2681 Briarwood Place
- 2162 Shady Brook Dr
- 1546 Holly Ct
- 2809 Shelter Wood Ct
- 2749 Amber Wood Place
- 3223 Monte Carlo Dr
- 3247 Monte Carlo Dr
- 3234 Rickey Ct
- 3222 Rickey Ct
- 3211 Monte Carlo Dr
- 3259 Monte Carlo Dr
- 3246 Rickey Ct
- 3210 Rickey Ct
- 3248 Monte Carlo Dr
- 3260 Monte Carlo Dr
- 3236 Monte Carlo Dr
- 3224 Monte Carlo Dr
- 3199 Monte Carlo Dr
- 3198 Rickey Ct
- 3212 Monte Carlo Dr
- 3200 Monte Carlo Dr
- 3221 Rickey Ct
- 3209 Rickey Ct
- 3233 Rickey Ct
- 3275 Rikkard Dr