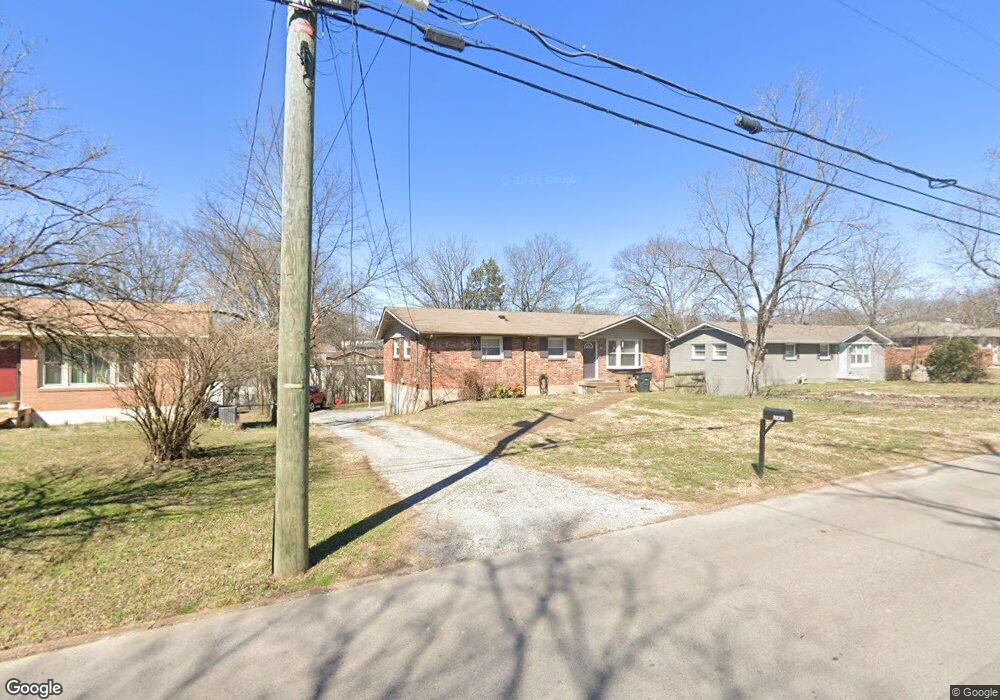
3235 Spears Rd Nashville, TN 37207
Parkwood Estates NeighborhoodEstimated Value: $291,000 - $344,000
3
Beds
2
Baths
1,800
Sq Ft
$179/Sq Ft
Est. Value
About This Home
This home is located at 3235 Spears Rd, Nashville, TN 37207 and is currently estimated at $323,081, approximately $179 per square foot. 3235 Spears Rd is a home located in Davidson County with nearby schools including Chadwell Elementary School, Jere Baxter Middle, and Maplewood Comprehensive High School.
Ownership History
Date
Name
Owned For
Owner Type
Purchase Details
Closed on
Sep 1, 2015
Sold by
Regg Andy
Bought by
Creighton Partners Gp
Current Estimated Value
Purchase Details
Closed on
Aug 12, 2015
Sold by
Fearnley Michael A
Bought by
Regg Andy
Purchase Details
Closed on
Mar 16, 2011
Sold by
The Secretary Of Housing & Urban Develop
Bought by
Smith Vernon
Home Financials for this Owner
Home Financials are based on the most recent Mortgage that was taken out on this home.
Original Mortgage
$54,787
Interest Rate
5.5%
Mortgage Type
FHA
Purchase Details
Closed on
Jun 9, 2010
Sold by
Tennessee Housing Development Agency
Bought by
Secretary Of Housing & Urban Development
Purchase Details
Closed on
Sep 29, 2004
Sold by
White Lenetta
Bought by
Spears Tameka D
Home Financials for this Owner
Home Financials are based on the most recent Mortgage that was taken out on this home.
Original Mortgage
$104,139
Interest Rate
5.75%
Mortgage Type
FHA
Create a Home Valuation Report for This Property
The Home Valuation Report is an in-depth analysis detailing your home's value as well as a comparison with similar homes in the area
Home Values in the Area
Average Home Value in this Area
Purchase History
| Date | Buyer | Sale Price | Title Company |
|---|---|---|---|
| Creighton Partners Gp | $70,000 | Attorney | |
| Regg Andy | $62,485 | Attorney | |
| Smith Vernon | $51,000 | None Available | |
| Secretary Of Housing & Urban Development | $107,433 | None Available | |
| Spears Tameka D | $105,000 | Taylor Title & Escrow Inc |
Source: Public Records
Mortgage History
| Date | Status | Borrower | Loan Amount |
|---|---|---|---|
| Previous Owner | Smith Vernon | $54,787 | |
| Previous Owner | Spears Tameka D | $104,139 |
Source: Public Records
Tax History Compared to Growth
Tax History
| Year | Tax Paid | Tax Assessment Tax Assessment Total Assessment is a certain percentage of the fair market value that is determined by local assessors to be the total taxable value of land and additions on the property. | Land | Improvement |
|---|---|---|---|---|
| 2024 | $1,721 | $52,875 | $11,250 | $41,625 |
| 2023 | $1,721 | $52,875 | $11,250 | $41,625 |
| 2022 | $1,721 | $52,875 | $11,250 | $41,625 |
| 2021 | $1,739 | $52,875 | $11,250 | $41,625 |
| 2020 | $1,204 | $28,525 | $8,250 | $20,275 |
| 2019 | $900 | $28,525 | $8,250 | $20,275 |
| 2018 | $900 | $28,525 | $8,250 | $20,275 |
| 2017 | $900 | $28,525 | $8,250 | $20,275 |
| 2016 | $1,079 | $23,900 | $5,000 | $18,900 |
| 2015 | $1,079 | $23,900 | $5,000 | $18,900 |
| 2014 | $1,079 | $23,900 | $5,000 | $18,900 |
Source: Public Records
Map
Nearby Homes
- 3214 Doverside Dr
- 3205 Leswood Ln
- 3225 Sennadale Ln
- 3240 Doverside Dr
- 3229 Moorewood Dr
- 3247 Masonwood Dr
- 3070 Richmond Hill Dr
- 3103 Brick Church Pike
- 3313 Leondale Terrace
- 3061 Richmond Hill Dr
- 3320 Chesapeake Cir
- 3253 Rainwood Dr
- 116 Tiger Cir
- 3172 Lauren Evelyn Way
- 388 Ewing Dr
- 0 Ewing Dr Unit RTC2807170
- 0 Ewing Dr Unit RTC3011325
- 0 Ewing Dr Unit RTC2989232
- 3136 Lauren Evelyn Way
- 3116 Lauren Evelyn Way
- 3233 Spears Rd
- 3237 Spears Rd
- 3231 Spears Rd
- 3239 Spears Rd
- 3234 Spears Rd
- 3232 Spears Rd
- 3229 Spears Rd
- 3241 Spears Rd
- 3230 Spears Rd
- 3240 Spears Rd
- 3218 Doverside Dr
- 3216 Doverside Dr
- 3215 Leswood Ln
- 3220 Doverside Dr
- 3227 Spears Rd
- 3243 Spears Rd
- 3228 Spears Rd
- 3222 Doverside Dr
- 3242 Spears Rd
- 3216 Leswood Ln