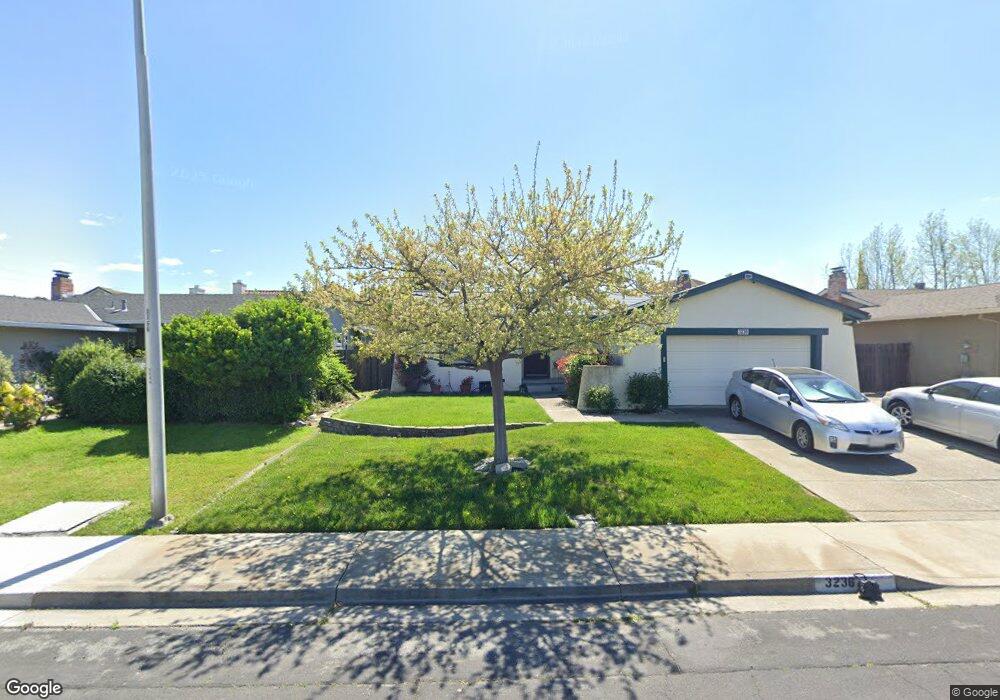
3236 S Francisco Way Antioch, CA 94509
Contra Loma NeighborhoodEstimated Value: $506,065 - $611,000
3
Beds
2
Baths
1,245
Sq Ft
$436/Sq Ft
Est. Value
About This Home
This home is located at 3236 S Francisco Way, Antioch, CA 94509 and is currently estimated at $542,766, approximately $435 per square foot. 3236 S Francisco Way is a home located in Contra Costa County with nearby schools including Sutter Elementary School, Park Middle School, and Antioch High School.
Ownership History
Date
Name
Owned For
Owner Type
Purchase Details
Closed on
Aug 11, 2014
Sold by
Dejesus Martinez Jose and Martinez Maritza Garay
Bought by
Martinez Maritza Garay
Current Estimated Value
Purchase Details
Closed on
Apr 27, 2010
Sold by
Martinez Jose De Jesus and Martinez Maritza G
Bought by
Martinez Jose De Jesus and Martinez Maritza Garay
Purchase Details
Closed on
Mar 29, 2006
Sold by
Martinez Jose De Jesus and Martinez Maritza G
Bought by
Martinez Jose De Jesus and Martinez Maritza G
Purchase Details
Closed on
May 4, 2000
Sold by
Eason Robert M and Eason Patricia
Bought by
Martinez Jose De Jesus and Martinez Martiza G
Home Financials for this Owner
Home Financials are based on the most recent Mortgage that was taken out on this home.
Original Mortgage
$185,130
Outstanding Balance
$64,325
Interest Rate
8.22%
Mortgage Type
VA
Estimated Equity
$478,441
Create a Home Valuation Report for This Property
The Home Valuation Report is an in-depth analysis detailing your home's value as well as a comparison with similar homes in the area
Home Values in the Area
Average Home Value in this Area
Purchase History
| Date | Buyer | Sale Price | Title Company |
|---|---|---|---|
| Martinez Maritza Garay | -- | None Available | |
| Martinez Jose De Jesus | -- | None Available | |
| Martinez Jose De Jesus | -- | Accommodation | |
| Martinez Jose De Jesus | $181,500 | Old Republic Title Company |
Source: Public Records
Mortgage History
| Date | Status | Borrower | Loan Amount |
|---|---|---|---|
| Open | Martinez Jose De Jesus | $185,130 |
Source: Public Records
Tax History Compared to Growth
Tax History
| Year | Tax Paid | Tax Assessment Tax Assessment Total Assessment is a certain percentage of the fair market value that is determined by local assessors to be the total taxable value of land and additions on the property. | Land | Improvement |
|---|---|---|---|---|
| 2025 | $3,596 | $278,941 | $107,577 | $171,364 |
| 2024 | $3,500 | $273,472 | $105,468 | $168,004 |
| 2023 | $3,500 | $268,110 | $103,400 | $164,710 |
| 2022 | $3,449 | $262,854 | $101,373 | $161,481 |
| 2021 | $3,314 | $257,701 | $99,386 | $158,315 |
| 2019 | $3,267 | $250,059 | $96,439 | $153,620 |
| 2018 | $3,153 | $245,157 | $94,549 | $150,608 |
| 2017 | $3,072 | $240,351 | $92,696 | $147,655 |
| 2016 | $2,999 | $235,639 | $90,879 | $144,760 |
| 2015 | $2,970 | $232,100 | $89,514 | $142,586 |
| 2014 | $2,463 | $190,000 | $73,278 | $116,722 |
Source: Public Records
Map
Nearby Homes
- 3326 Hacienda Way
- 4561 Union Ct
- 3366 S Francisco Way
- 3163 S Francisco Way
- 1205 Putnam St
- 3336 Fontana Place
- 2005 Cerro Ct
- 3019 El Monte Ct
- 3026 El Monte Ct
- 2208 Hamlin Dr
- 3207 Tabora Dr
- 3513 Stone Place
- 2924 Ventura Ct
- 2217 Hamlin Dr
- 2125 Robles Dr
- 1618 Putnam St
- 2108 Reseda Way
- 2205 Robles Dr
- 2225 Sherman Ct
- 920 Gloucester Ct
- 3300 S Francisco Way
- 3458 Lexington Way
- 3660 Lexington Ct
- 3454 Lexington Way
- 3228 S Francisco Way
- 3304 S Francisco Way
- 3450 Lexington Way
- 3224 S Francisco Way
- 3301 S Francisco Way
- 3308 S Francisco Way
- 3446 Lexington Way
- 3307 S Francisco Way
- 3220 S Francisco Way
- 3557 Centennial Dr
- 3665 Lexington Ct
- 3442 Lexington Way
- 3661 Lexington Ct
- 3644 Freedom Way
- 3657 Lexington Ct
- 3306 Hacienda Way