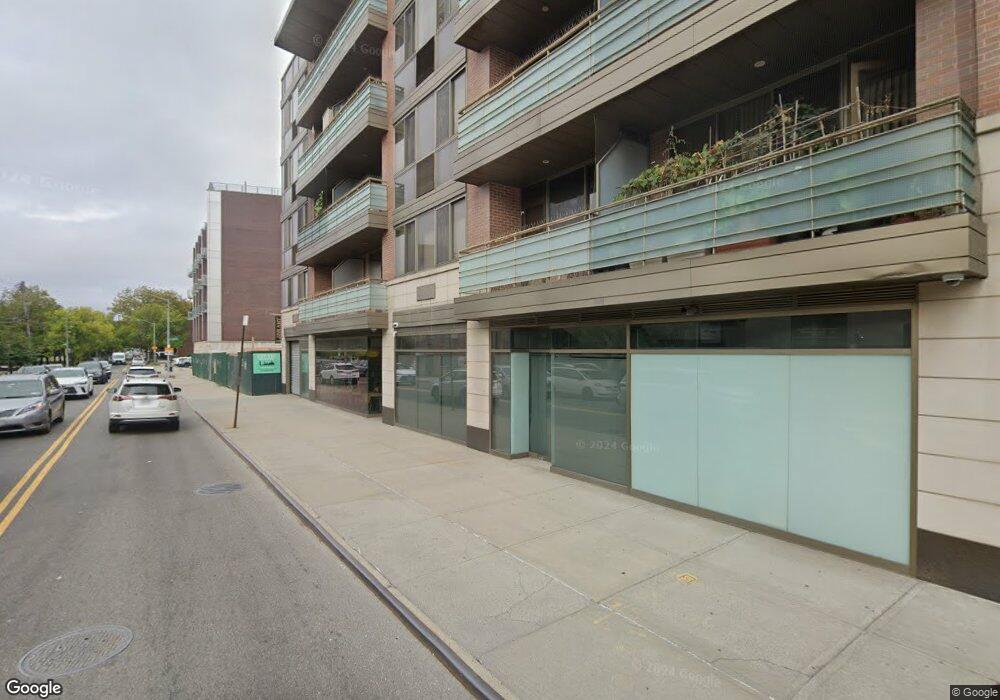
3236 Union St Unit 5C Flushing, NY 11354
Flushing-Willets Point NeighborhoodEstimated Value: $604,000 - $635,798
Studio
--
Bath
756
Sq Ft
$815/Sq Ft
Est. Value
About This Home
This home is located at 3236 Union St Unit 5C, Flushing, NY 11354 and is currently estimated at $615,950, approximately $814 per square foot. 3236 Union St Unit 5C is a home located in Queens County with nearby schools including P.S. 214 Cadwallader Colden, Jhs 185 Edward Bleeker, and Flushing High School.
Ownership History
Date
Name
Owned For
Owner Type
Purchase Details
Closed on
May 21, 2024
Sold by
Wong Chung Yin
Bought by
Sun Juan and Zheng S
Current Estimated Value
Purchase Details
Closed on
Jan 8, 2013
Sold by
Tang Wilson Wai Sun
Bought by
Wong Chung Yin
Home Financials for this Owner
Home Financials are based on the most recent Mortgage that was taken out on this home.
Original Mortgage
$260,000
Interest Rate
3.35%
Mortgage Type
New Conventional
Purchase Details
Closed on
Jul 28, 2009
Sold by
L M T R Development Inc
Bought by
Tang Wilson Wai-Sun
Home Financials for this Owner
Home Financials are based on the most recent Mortgage that was taken out on this home.
Original Mortgage
$133,800
Interest Rate
5.47%
Mortgage Type
Purchase Money Mortgage
Create a Home Valuation Report for This Property
The Home Valuation Report is an in-depth analysis detailing your home's value as well as a comparison with similar homes in the area
Home Values in the Area
Average Home Value in this Area
Purchase History
| Date | Buyer | Sale Price | Title Company |
|---|---|---|---|
| Sun Juan | $595,000 | -- | |
| Sun Juan | $595,000 | -- | |
| Wong Chung Yin | $360,000 | -- | |
| Wong Chung Yin | $360,000 | -- | |
| Tang Wilson Wai-Sun | $191,250 | -- | |
| Tang Wilson Wai-Sun | $191,250 | -- |
Source: Public Records
Mortgage History
| Date | Status | Borrower | Loan Amount |
|---|---|---|---|
| Previous Owner | Wong Chung Yin | $260,000 | |
| Previous Owner | Tang Wilson Wai-Sun | $133,800 |
Source: Public Records
Tax History
| Year | Tax Paid | Tax Assessment Tax Assessment Total Assessment is a certain percentage of the fair market value that is determined by local assessors to be the total taxable value of land and additions on the property. | Land | Improvement |
|---|---|---|---|---|
| 2025 | $8,706 | $88,080 | $17,798 | $70,282 |
| 2024 | $8,706 | $86,564 | $17,798 | $68,766 |
| 2023 | $6,498 | $85,339 | $15,584 | $69,755 |
| 2022 | $4,214 | $87,840 | $17,798 | $70,042 |
| 2021 | $2,151 | $79,966 | $17,798 | $62,168 |
| 2020 | $238 | $86,884 | $17,798 | $69,086 |
| 2019 | $241 | $84,017 | $6,728 | $77,289 |
| 2018 | $245 | $70,286 | $6,728 | $63,558 |
| 2017 | $245 | $68,738 | $6,728 | $62,010 |
| 2016 | $248 | $68,738 | $6,728 | $62,010 |
| 2015 | $194 | $64,856 | $6,728 | $58,128 |
| 2014 | $194 | $64,413 | $6,726 | $57,687 |
Source: Public Records
Map
Nearby Homes
- 33-05 143rd St Unit 1405
- 140-21 32nd Ave Unit 5Cn
- 140-21 32nd Ave Unit 6An
- 14018 33rd Ave Unit 104
- 14021 32nd Ave Unit 5C
- 31-22 Union St Unit 2D
- 139-19 34th Ave
- 140-03 32nd Ave
- 140-24 31st Dr Unit 2C
- 13911 34th Ave
- 13909 34th Ave
- 13907 34th Ave
- 31-90 140th St Unit 2B
- 3029 143rd St
- 139-30 34th Ave Unit 4C
- 141-52 33rd Ave Unit 3C
- 140-39 34th Ave Unit 2T
- 138-35 39th Ave Unit 12L
- 138-35 39th Ave Unit 17H
- 138-35 39th Ave Unit 4K
- 3236 Union St Unit 5E
- 3236 Union St Unit 4E
- 3236 Union St Unit 3E
- 3236 Union St Unit 2E
- 3236 Union St Unit 5D
- 3236 Union St Unit 4D
- 3236 Union St Unit 3D
- 3236 Union St Unit 2D
- 3236 Union St Unit 6C
- 3236 Union St Unit 4C
- 3236 Union St Unit 3C
- 3236 Union St Unit 2C
- 3236 Union St Unit 6B
- 3236 Union St Unit 5B
- 3236 Union St Unit 4B
- 3236 Union St Unit 3B
- 3236 Union St Unit 2B
- 3236 Union St Unit 6A
- 3236 Union St Unit 5A
- 3236 Union St Unit 4A
Your Personal Tour Guide
Ask me questions while you tour the home.