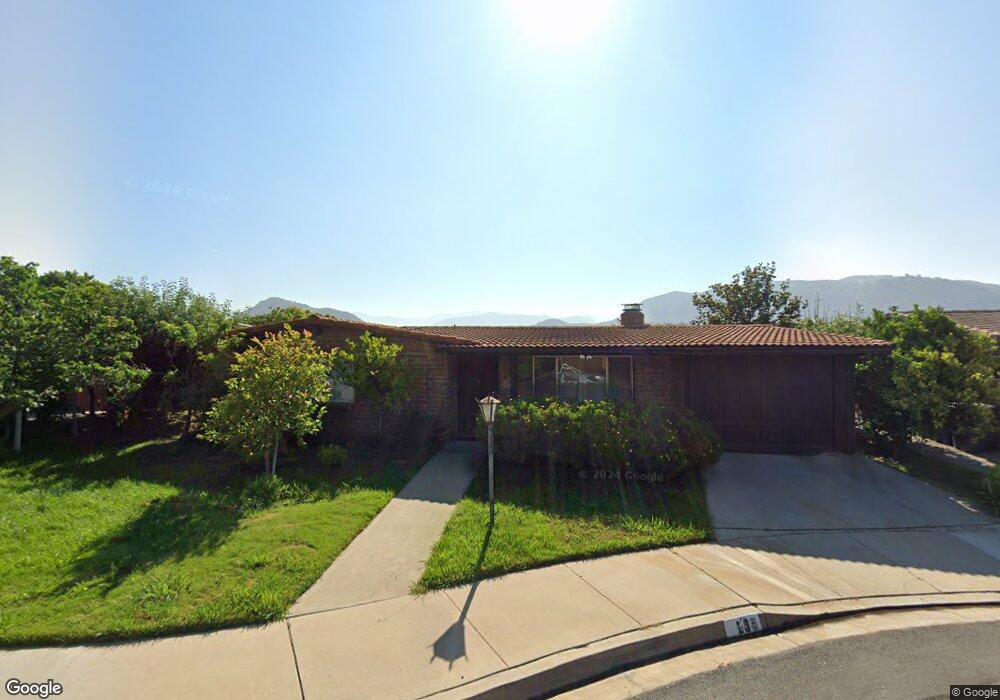
3236 Via Almonte Fallbrook, CA 92028
Estimated Value: $594,538 - $701,000
2
Beds
2
Baths
1,124
Sq Ft
$587/Sq Ft
Est. Value
About This Home
This home is located at 3236 Via Almonte, Fallbrook, CA 92028 and is currently estimated at $659,635, approximately $586 per square foot. 3236 Via Almonte is a home located in San Diego County with nearby schools including Bonsall Elementary School, Sullivan Middle School, and Bonsall High.
Ownership History
Date
Name
Owned For
Owner Type
Purchase Details
Closed on
Oct 10, 2016
Sold by
Ely Julian
Bought by
Ely Julian B
Current Estimated Value
Purchase Details
Closed on
Dec 16, 2003
Sold by
Carpenter Rosemary R
Bought by
Carpenter Rosemary R
Purchase Details
Closed on
Oct 21, 1994
Sold by
Muschinske Johanna P
Bought by
Chang William C and Carpenter Rosemary R
Home Financials for this Owner
Home Financials are based on the most recent Mortgage that was taken out on this home.
Original Mortgage
$94,900
Interest Rate
8.78%
Mortgage Type
Small Business Administration
Purchase Details
Closed on
Apr 12, 1989
Purchase Details
Closed on
May 21, 1987
Purchase Details
Closed on
Jan 30, 1987
Create a Home Valuation Report for This Property
The Home Valuation Report is an in-depth analysis detailing your home's value as well as a comparison with similar homes in the area
Home Values in the Area
Average Home Value in this Area
Purchase History
| Date | Buyer | Sale Price | Title Company |
|---|---|---|---|
| Ely Julian B | -- | None Available | |
| Carpenter Rosemary R | -- | -- | |
| Chang William C | $110,000 | First American Title Co | |
| -- | $139,400 | -- | |
| -- | $110,000 | -- | |
| -- | $105,000 | -- |
Source: Public Records
Mortgage History
| Date | Status | Borrower | Loan Amount |
|---|---|---|---|
| Closed | Chang William C | $94,900 | |
| Closed | Chang William C | $90,000 |
Source: Public Records
Tax History
| Year | Tax Paid | Tax Assessment Tax Assessment Total Assessment is a certain percentage of the fair market value that is determined by local assessors to be the total taxable value of land and additions on the property. | Land | Improvement |
|---|---|---|---|---|
| 2025 | $3,743 | $361,051 | $236,756 | $124,295 |
| 2024 | $3,743 | $353,972 | $232,114 | $121,858 |
| 2023 | $3,660 | $347,032 | $227,563 | $119,469 |
| 2022 | $3,598 | $340,228 | $223,101 | $117,127 |
| 2021 | $3,535 | $333,558 | $218,727 | $114,831 |
| 2020 | $3,507 | $330,139 | $216,485 | $113,654 |
| 2019 | $3,441 | $323,667 | $212,241 | $111,426 |
| 2018 | $3,459 | $317,322 | $208,080 | $109,242 |
| 2017 | $3,391 | $311,100 | $204,000 | $107,100 |
| 2016 | $1,638 | $156,059 | $63,840 | $92,219 |
| 2015 | $1,612 | $153,716 | $62,882 | $90,834 |
| 2014 | $1,580 | $150,706 | $61,651 | $89,055 |
Source: Public Records
Map
Nearby Homes
- 4706 Via Tala
- 3029 Via de Todos Santos
- 3021 Jicarilla Dr
- 4408 Brodea Ln
- 0 Brodea Ln Unit NDP2506737
- 4841 Dulin Rd
- 4308 Los Padres Dr
- 4320 Los Padres Dr
- 4346 Los Padres Dr
- 3264 Shearer Crossing
- 34758 Criollo Way
- 3954 Lake Shore St
- 3605 Lake Circle Dr
- 4650 Dulin Rd Unit 175
- 4650 Dulin Rd Unit 42
- 4650 Dulin Rd Unit 137
- 4650 Dulin Rd Unit SPC 1
- 4650 Dulin Rd Unit 27
- 4650 Dulin Rd Unit 192
- 4650 Dulin Rd Unit 178
- 3230 Via Almonte
- 3217 Via de Todos Santos
- 3242 Via Almonte
- 3221 Via de Todos Santos
- 3241 Via Almonte
- 3224 Via Almonte
- 3248 Via Almonte
- 3235 Via Almonte
- 3225 Via de Todos Santos
- 3247 Via Almonte
- 3209 Via de Todos Santos
- 3229 Via Almonte
- 3218 Via Almonte
- 4744 Via Serra
- 4732 Via Serra
- 4756 Via Serra
- 3205 Via de Todos Santos
- 4731 Via Inca
- 4720 Via Serra
- 3212 Via Almonte
Your Personal Tour Guide
Ask me questions while you tour the home.