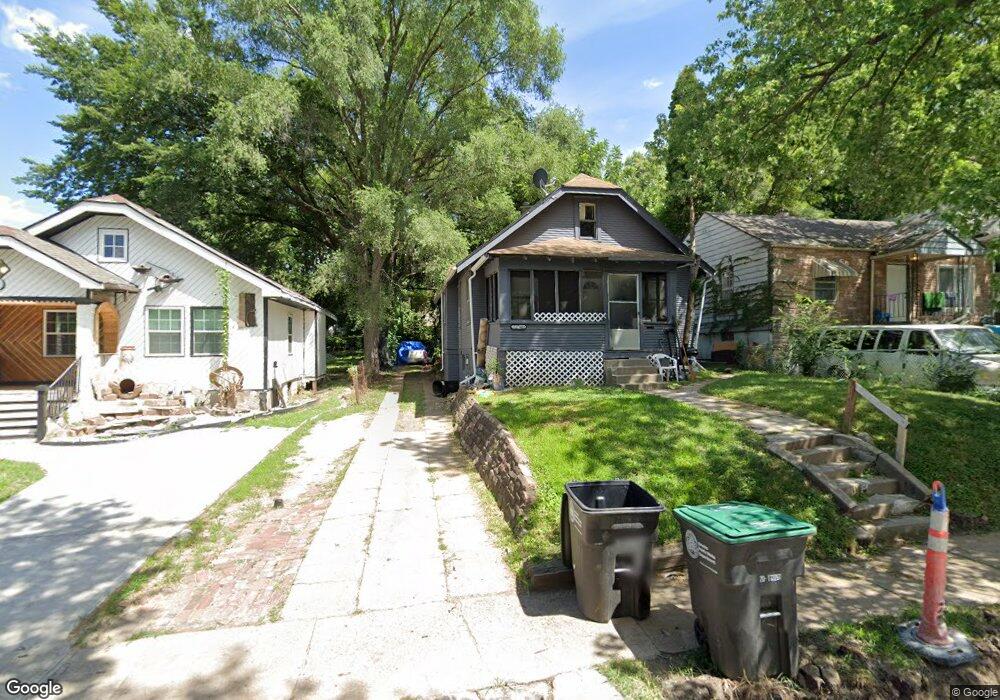
3237 N 41st St Omaha, NE 68111
Clifton Hills NeighborhoodEstimated Value: $121,802 - $157,000
3
Beds
1
Bath
1,110
Sq Ft
$129/Sq Ft
Est. Value
About This Home
This home is located at 3237 N 41st St, Omaha, NE 68111 and is currently estimated at $142,701, approximately $128 per square foot. 3237 N 41st St is a home located in Douglas County with nearby schools including King Elementary School, Monroe Middle School, and Benson Magnet High School.
Ownership History
Date
Name
Owned For
Owner Type
Purchase Details
Closed on
Jan 2, 2020
Sold by
Omaha Municipal Land Bank
Bought by
Mohan Sujatha
Current Estimated Value
Purchase Details
Closed on
Oct 1, 2019
Sold by
Koch John R and Omaha Muni Land Bk & Cnty Of D
Bought by
Omaha Municipal Land Bank
Purchase Details
Closed on
Nov 18, 2015
Sold by
Waba Financial
Bought by
Koch John R
Purchase Details
Closed on
Jun 11, 2014
Sold by
Woods Shawn
Bought by
Waba Financial
Purchase Details
Closed on
Apr 9, 2014
Sold by
Woods Shawn
Bought by
Waba Financial
Purchase Details
Closed on
Jun 14, 2011
Sold by
Vandelay Investments L L C
Bought by
Woods Shawn
Purchase Details
Closed on
Sep 15, 2010
Sold by
County Of Douglas
Bought by
Vandelay Investments Llc
Purchase Details
Closed on
Mar 13, 2002
Sold by
Decenzo Kenneth A and Decenzo Sherri L
Bought by
Woods Shawn
Create a Home Valuation Report for This Property
The Home Valuation Report is an in-depth analysis detailing your home's value as well as a comparison with similar homes in the area
Home Values in the Area
Average Home Value in this Area
Purchase History
| Date | Buyer | Sale Price | Title Company |
|---|---|---|---|
| Mohan Sujatha | $11,000 | None Available | |
| Omaha Municipal Land Bank | $13,271 | None Available | |
| Koch John R | $5,000 | None Available | |
| Waba Financial | $1,300 | None Available | |
| Waba Financial | $1,300 | None Available | |
| Woods Shawn | -- | None Available | |
| Vandelay Investments Llc | $502 | None Available | |
| Woods Shawn | $20,000 | -- |
Source: Public Records
Tax History
| Year | Tax Paid | Tax Assessment Tax Assessment Total Assessment is a certain percentage of the fair market value that is determined by local assessors to be the total taxable value of land and additions on the property. | Land | Improvement |
|---|---|---|---|---|
| 2025 | $1,214 | $90,200 | $7,500 | $82,700 |
| 2024 | $1,584 | $75,100 | $7,500 | $67,600 |
| 2023 | $1,584 | $75,100 | $7,500 | $67,600 |
| 2022 | $1,065 | $49,900 | $7,500 | $42,400 |
| 2021 | $413 | $19,500 | $7,500 | $12,000 |
| 2020 | $306 | $14,300 | $7,500 | $6,800 |
| 2019 | $0 | $4,400 | $700 | $3,700 |
| 2018 | $95 | $4,400 | $700 | $3,700 |
| 2017 | $88 | $13,400 | $700 | $12,700 |
| 2016 | $88 | $4,100 | $600 | $3,500 |
| 2015 | $783 | $10,500 | $2,400 | $8,100 |
| 2014 | $783 | $37,000 | $2,400 | $34,600 |
Source: Public Records
Map
Nearby Homes
- 3241 N 41st St
- 3235 N 41st St
- 3245 N 41st St
- 3229 N 41st St
- 3225 N 41st St
- 3240 N 40th Ave
- 3244 N 40th Ave
- 3236 N 40th Ave
- 3223 N 41st St
- 3246 N 40th Ave
- 3232 N 40th Ave
- 3234 N 41st St
- 4103 Bedford Ave
- 3228 N 40th Ave
- 3236 N 40 Ave
- 3238 N 41st St
- 4072 Bedford Ave
- 3232 N 40th Ave
- 3230 N 41st St
- 3224 N 40th Ave
Your Personal Tour Guide
Ask me questions while you tour the home.