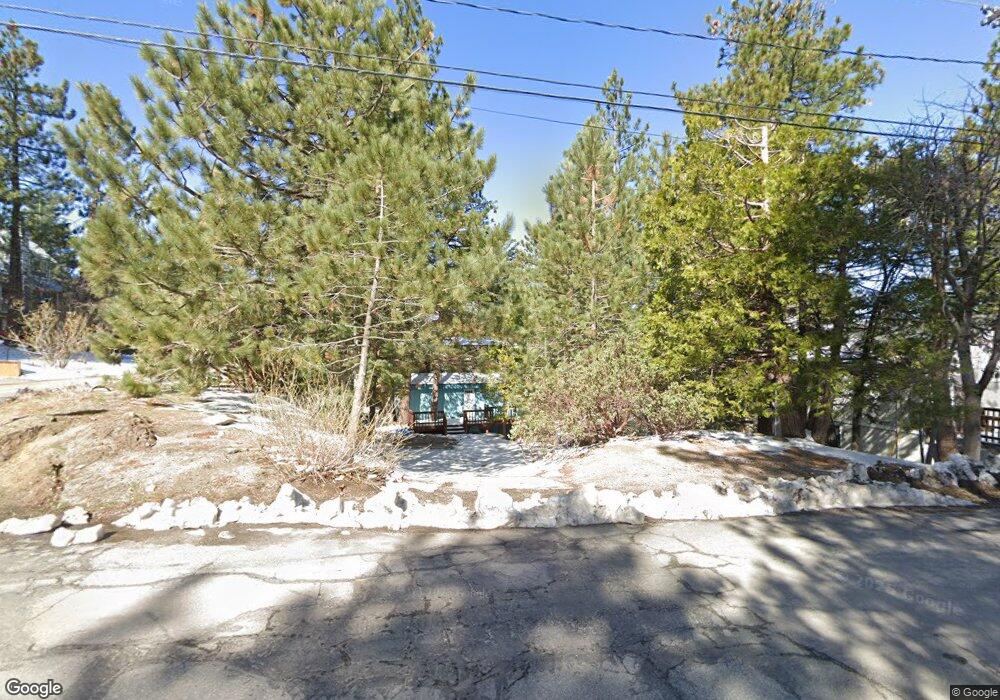
32370 Nordic Dr Running Springs, CA 92382
Estimated Value: $333,000 - $504,000
3
Beds
2
Baths
1,056
Sq Ft
$382/Sq Ft
Est. Value
About This Home
This home is located at 32370 Nordic Dr, Running Springs, CA 92382 and is currently estimated at $403,385, approximately $381 per square foot. 32370 Nordic Dr is a home with nearby schools including Charles Hoffman Elementary School, Mary P. Henck Intermediate School, and Rim Of The World Senior High School.
Ownership History
Date
Name
Owned For
Owner Type
Purchase Details
Closed on
Nov 15, 2023
Sold by
Sullivan Donald
Bought by
Our Village Trust and Sullivan
Current Estimated Value
Purchase Details
Closed on
Sep 3, 2002
Sold by
Sullivan Connie
Bought by
Sullivan Donald
Home Financials for this Owner
Home Financials are based on the most recent Mortgage that was taken out on this home.
Original Mortgage
$119,920
Interest Rate
6.17%
Purchase Details
Closed on
Sep 16, 1999
Sold by
Swanson Ann Hilton and Goering Stanley
Bought by
Goering Stanley and Swanson Ann Hilton
Purchase Details
Closed on
Mar 20, 1997
Sold by
Archer Duel Robert A and Archer Lois
Bought by
Goering Stanley and Swanson Ann Hilton
Home Financials for this Owner
Home Financials are based on the most recent Mortgage that was taken out on this home.
Original Mortgage
$75,000
Interest Rate
7.74%
Create a Home Valuation Report for This Property
The Home Valuation Report is an in-depth analysis detailing your home's value as well as a comparison with similar homes in the area
Home Values in the Area
Average Home Value in this Area
Purchase History
| Date | Buyer | Sale Price | Title Company |
|---|---|---|---|
| Our Village Trust | -- | None Listed On Document | |
| Sullivan Donald | -- | Fidelity National Title | |
| Sullivan Donald | $150,000 | Fidelity National Title | |
| Goering Stanley | -- | -- | |
| Goering Stanley | $113,500 | First American Title Ins Co |
Source: Public Records
Mortgage History
| Date | Status | Borrower | Loan Amount |
|---|---|---|---|
| Previous Owner | Sullivan Donald | $119,920 | |
| Previous Owner | Sullivan Donald | $14,990 | |
| Previous Owner | Goering Stanley | $75,000 |
Source: Public Records
Tax History Compared to Growth
Tax History
| Year | Tax Paid | Tax Assessment Tax Assessment Total Assessment is a certain percentage of the fair market value that is determined by local assessors to be the total taxable value of land and additions on the property. | Land | Improvement |
|---|---|---|---|---|
| 2025 | $2,783 | $217,105 | $54,276 | $162,829 |
| 2024 | $2,783 | $212,848 | $53,212 | $159,636 |
| 2023 | $2,752 | $208,675 | $52,169 | $156,506 |
| 2022 | $2,701 | $204,583 | $51,146 | $153,437 |
| 2021 | $2,673 | $200,571 | $50,143 | $150,428 |
| 2020 | $2,673 | $198,515 | $49,629 | $148,886 |
| 2019 | $2,609 | $194,623 | $48,656 | $145,967 |
| 2018 | $2,469 | $190,807 | $47,702 | $143,105 |
| 2017 | $2,426 | $187,066 | $46,767 | $140,299 |
| 2016 | $2,356 | $183,398 | $45,850 | $137,548 |
| 2015 | $2,331 | $180,643 | $45,161 | $135,482 |
| 2014 | $2,295 | $177,104 | $44,276 | $132,828 |
Source: Public Records
Map
Nearby Homes
- 0 Cobblestone Ln Unit IG24253088
- 32296 Fern Dr
- 2686 Viking Ln
- 32311 Fern Dr
- 32490 Scandia Dr
- 32220 Mohan Way
- 32455 Scandia Dr
- 32538 Scandia Dr
- 32159 Cove Cir
- 32065 Hunsaker Way Unit 12
- 32079 Fern Dr
- 32068 Hunsaker Way
- 2442 Hunsaker Dr
- 2395 Hunsaker Dr
- 2493 Palo Alto Way
- 2344 Deep Creek Dr
- 0 Deep Creek Dr
- 2564 Spring Dr
- 2462 Spring Dr
- 2430 Palo Alto Way
- 2610 Valhalla Dr
- 32364 Nordic Dr
- 32373 Nordic Dr
- 2600 Valhalla Dr
- 32394 Nordic Dr
- 32361 Fern Dr
- 32363 Nordic Dr
- 2603 Valhalla Dr
- 32351 Fern Dr
- 2650 Valhalla Dr
- 32395 Nordic Dr
- 32341 Fern Dr
- 32346 Nordic Dr
- 2608 Viking Ln
- 2618 Viking Ln
- 32408 Nordic Dr
- 2662 Valhalla Dr
- 2655 Valhalla Dr
- 2575 Idyllwild Dr
- 32340 Nordic Dr