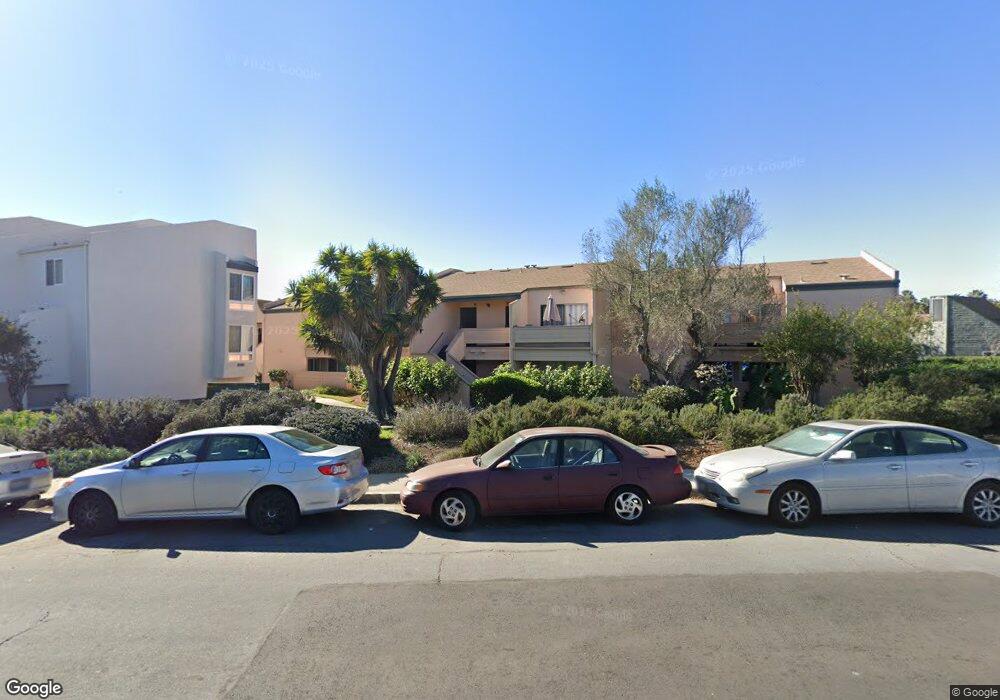
3238 Ashford St Unit A San Diego, CA 92111
Clairemont Mesa East NeighborhoodEstimated Value: $371,000 - $444,000
2
Beds
1
Bath
716
Sq Ft
$581/Sq Ft
Est. Value
About This Home
This home is located at 3238 Ashford St Unit A, San Diego, CA 92111 and is currently estimated at $415,652, approximately $580 per square foot. 3238 Ashford St Unit A is a home located in San Diego County with nearby schools including Ross Elementary, Montgomery Middle School, and San Diego Cooperative Charter School.
Ownership History
Date
Name
Owned For
Owner Type
Purchase Details
Closed on
Feb 12, 2021
Sold by
Findlay Rebecca L
Bought by
Findlay Rebecca L
Current Estimated Value
Home Financials for this Owner
Home Financials are based on the most recent Mortgage that was taken out on this home.
Original Mortgage
$171,000
Outstanding Balance
$152,941
Interest Rate
2.7%
Mortgage Type
New Conventional
Estimated Equity
$262,711
Purchase Details
Closed on
Nov 6, 2015
Sold by
Lott Christine
Bought by
Findlay Rebecca L
Home Financials for this Owner
Home Financials are based on the most recent Mortgage that was taken out on this home.
Original Mortgage
$180,500
Interest Rate
3.96%
Mortgage Type
New Conventional
Purchase Details
Closed on
Nov 2, 2015
Sold by
Hill Steven M
Bought by
Findlay Rebecca L
Home Financials for this Owner
Home Financials are based on the most recent Mortgage that was taken out on this home.
Original Mortgage
$180,500
Interest Rate
3.96%
Mortgage Type
New Conventional
Purchase Details
Closed on
Aug 15, 2003
Sold by
Vaca Veronica
Bought by
Hill Steven M
Home Financials for this Owner
Home Financials are based on the most recent Mortgage that was taken out on this home.
Original Mortgage
$151,200
Interest Rate
6%
Mortgage Type
Purchase Money Mortgage
Create a Home Valuation Report for This Property
The Home Valuation Report is an in-depth analysis detailing your home's value as well as a comparison with similar homes in the area
Home Values in the Area
Average Home Value in this Area
Purchase History
| Date | Buyer | Sale Price | Title Company |
|---|---|---|---|
| Findlay Rebecca L | -- | Corinthian Title Company | |
| Findlay Rebecca L | -- | Equity Title San Diego | |
| Findlay Rebecca L | $190,000 | Equity Title San Diego | |
| Hill Steven M | $189,000 | Lawyers Title Company |
Source: Public Records
Mortgage History
| Date | Status | Borrower | Loan Amount |
|---|---|---|---|
| Open | Findlay Rebecca L | $171,000 | |
| Previous Owner | Findlay Rebecca L | $180,500 | |
| Previous Owner | Hill Steven M | $151,200 |
Source: Public Records
Tax History Compared to Growth
Tax History
| Year | Tax Paid | Tax Assessment Tax Assessment Total Assessment is a certain percentage of the fair market value that is determined by local assessors to be the total taxable value of land and additions on the property. | Land | Improvement |
|---|---|---|---|---|
| 2025 | $2,740 | $224,911 | $128,949 | $95,962 |
| 2024 | $2,740 | $220,502 | $126,421 | $94,081 |
| 2023 | $2,679 | $216,180 | $123,943 | $92,237 |
| 2022 | $2,608 | $211,942 | $121,513 | $90,429 |
| 2021 | $2,591 | $207,787 | $119,131 | $88,656 |
| 2020 | $2,560 | $205,657 | $117,910 | $87,747 |
| 2019 | $2,514 | $201,626 | $115,599 | $86,027 |
| 2018 | $2,352 | $197,674 | $113,333 | $84,341 |
| 2017 | $2,296 | $193,799 | $111,111 | $82,688 |
| 2016 | $2,259 | $190,000 | $108,933 | $81,067 |
| 2015 | $1,708 | $150,000 | $86,000 | $64,000 |
| 2014 | $1,361 | $120,000 | $69,000 | $51,000 |
Source: Public Records
Map
Nearby Homes
- 3266 Ashford St Unit M
- 3230 Ashford St Unit A
- 3230 Ashford St Unit B
- 3250 Ashford St Unit F
- 3271 Atlas St
- 3373 Armstrong St
- 7555 Linda Vista Unit 9
- 7273 Arillo St
- 7265 Arillo St
- 3484 Armstrong St
- 7613 Family Cir Unit LU5
- 8036 Linda Vista Rd Unit 2
- 8036 Linda Vista Rd Unit 1F
- 8036 Linda Vista Rd Unit 2P
- 7797 Stalmer St Unit 1F
- 3505 Angelucci St Unit 1C
- 3505 Angelucci St Unit 2E
- 3282 Berger Ave Unit D1
- 3516 Atoll St
- 7131 Malta St
- 3238 Ashford St Unit Ashford
- 3238 Ashford St Unit P
- 3238 Ashford St Unit P
- 3238 Ashford St
- 3238 Ashford St Unit D
- 3238 Ashford St Unit O
- 3238 Ashford St Unit 129
- 3238 Ashford St Unit K
- 3238 Ashford St Unit J
- 3238 Ashford St Unit E
- 3238 Ashford St Unit F
- 3238 Ashford St Unit B
- 3238 Ashford St Unit M
- 3238 Ashford St Unit N
- 3238 Ashford St Unit I
- 3238 Ashford St Unit L
- 3238 Ashford St Unit G
- 3238 Ashford St Unit H
- 3238 Ashford St Unit C
- 3238 Ashford St Unit D