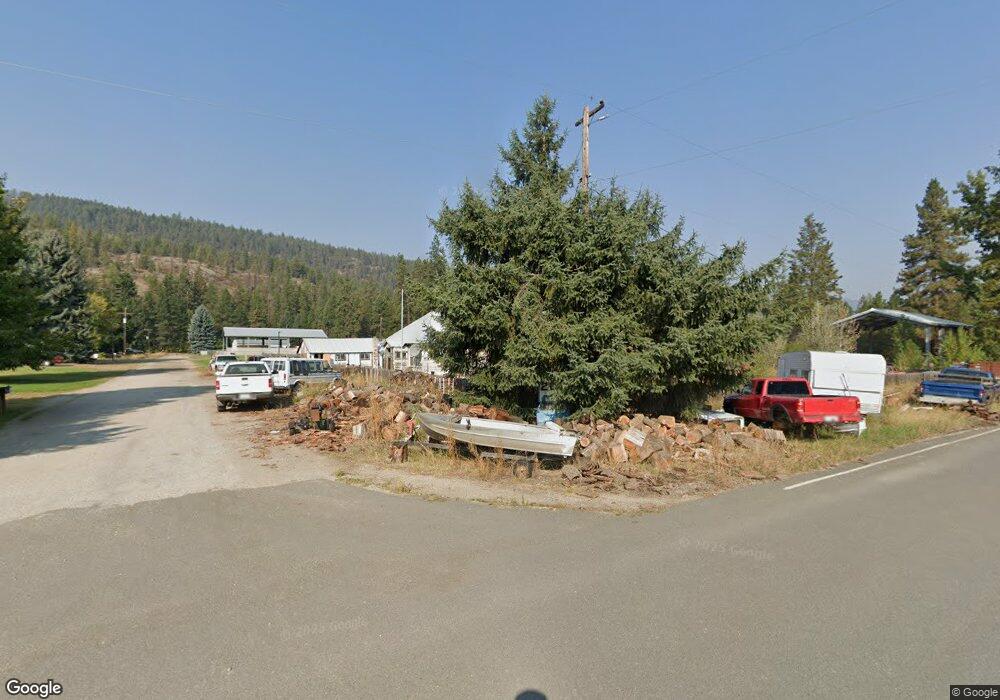
324 C St Orient, WA 99160
Estimated Value: $117,542 - $156,000
Studio
--
Bath
1,396
Sq Ft
$98/Sq Ft
Est. Value
About This Home
This home is located at 324 C St, Orient, WA 99160 and is currently estimated at $136,181, approximately $97 per square foot. 324 C St is a home located in Ferry County with nearby schools including Columbia Virtual Academy-Orient and Orient Elementary School.
Ownership History
Date
Name
Owned For
Owner Type
Purchase Details
Closed on
Oct 9, 2001
Sold by
Bell Erwin J and Bell Kathryn E
Bought by
Porter Cynthia R
Current Estimated Value
Purchase Details
Closed on
Aug 17, 2001
Sold by
Wiley Alan B
Bought by
Bell Erwin J and Bell Kathryn E
Purchase Details
Closed on
Jan 18, 1994
Sold by
Wiley Alan B
Bought by
Porter Cynthia R
Purchase Details
Closed on
Aug 14, 1992
Sold by
Wiley Lawrence D
Bought by
Wiley Alan B
Purchase Details
Closed on
Sep 16, 1991
Sold by
Wiley Alan B
Bought by
Wiley Lawrence D
Purchase Details
Closed on
Jan 26, 1984
Sold by
Anderson Henry T and Anderson Tressia C
Bought by
Matlock Stanley E
Purchase Details
Closed on
Mar 4, 1983
Sold by
Borders Albert C 7 Emily D
Bought by
Matlock Stanley E
Purchase Details
Closed on
Aug 19, 1982
Sold by
Matlock Stanley E and Matlock Terri J
Bought by
Wiley Alan B
Purchase Details
Closed on
Feb 26, 1981
Sold by
Matlock Stanley E and Matlock Terri J
Bought by
Wiley Alan B
Create a Home Valuation Report for This Property
The Home Valuation Report is an in-depth analysis detailing your home's value as well as a comparison with similar homes in the area
Purchase History
We collect this data history from publicly available records. To have your information removed, we recommend requesting removal directly through your county’s website.
| Date | Buyer | Sale Price | Title Company |
|---|---|---|---|
| Porter Cynthia R | -- | -- | |
| Bell Erwin J | -- | -- | |
| Porter Cynthia R | $43,500 | -- | |
| Wiley Alan B | -- | -- | |
| Wiley Lawrence D | -- | -- | |
| Matlock Stanley E | -- | -- | |
| Matlock Stanley E | $12,000 | -- | |
| Wiley Alan B | -- | -- | |
| Wiley Alan B | $30,900 | -- |
Source: Public Records
Tax History
| Year | Tax Paid | Tax Assessment Tax Assessment Total Assessment is a certain percentage of the fair market value that is determined by local assessors to be the total taxable value of land and additions on the property. | Land | Improvement |
|---|---|---|---|---|
| 2026 | $533 | $66,800 | $25,400 | $41,400 |
| 2025 | $515 | $64,300 | $20,700 | $43,600 |
| 2024 | $425 | $59,500 | $20,700 | $38,800 |
| 2023 | $456 | $61,300 | $25,000 | $36,300 |
| 2022 | $468 | $57,800 | $22,800 | $35,000 |
| 2021 | $590 | $57,800 | $22,800 | $35,000 |
| 2020 | $540 | $62,500 | $22,800 | $39,700 |
| 2019 | $484 | $56,800 | $22,800 | $34,000 |
| 2018 | $492 | $54,000 | $22,800 | $31,200 |
| 2017 | $443 | $54,000 | $22,800 | $31,200 |
| 2016 | $423 | $54,000 | $22,800 | $31,200 |
| 2015 | $429 | $54,000 | $22,800 | $31,200 |
| 2014 | -- | $55,000 | $22,800 | $32,200 |
Source: Public Records
Map
Nearby Homes
- 3349 Rockcut Rd
- 35XX Rockcut Rd
- 3500 Rockcut Rd
- 3XXX Rockcut Rd
- 3124 Orient Cutoff Rd
- 3733-XX Sand Creek Rd
- 3733 XX Sand Creek Rd
- 3XXX Sand Creek Rd
- 3797 Imperial Way
- 3115 Beardslee Rd
- 2897 McNitt Rd
- 2447 Pierre Lake Rd Unit A
- 28 First Thought Loop
- 67 First Thought Loop
- 36 First Thought Loop
- 40 First Thought Loop
- 40 First Thought Loop
- 2339 Kettle River Rd
- 2584D Bridgeman-Rettinger Rd
- 2584-F Bridgeman-Rettinger Rd
Your Personal Tour Guide
Ask me questions while you tour the home.