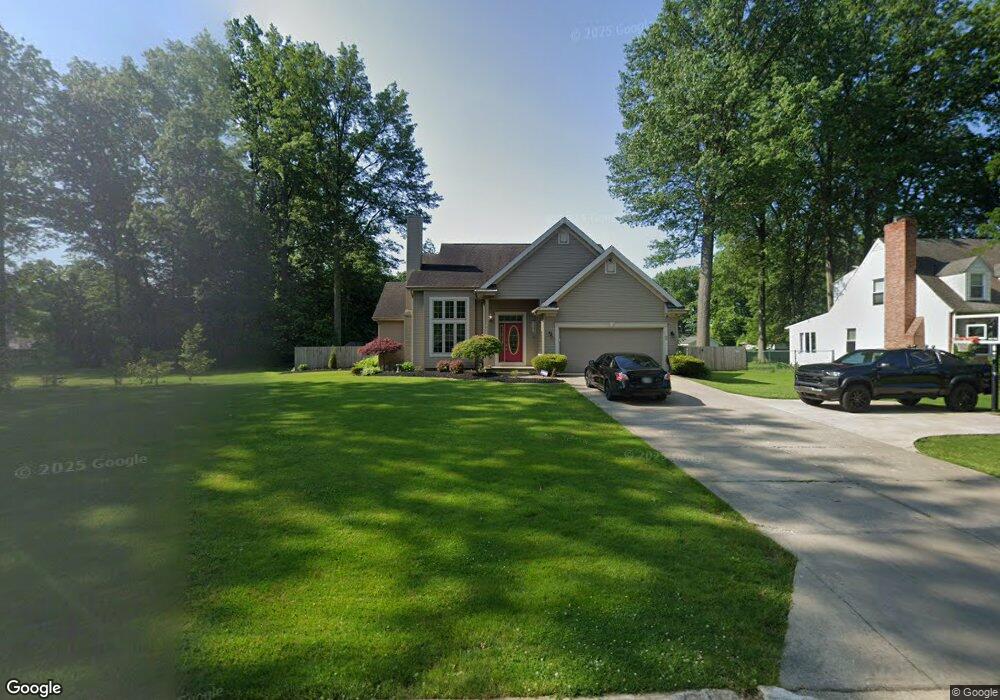
324 E 22nd St Ashtabula, OH 44004
Estimated Value: $216,000 - $339,000
3
Beds
3
Baths
1,820
Sq Ft
$150/Sq Ft
Est. Value
About This Home
This home is located at 324 E 22nd St, Ashtabula, OH 44004 and is currently estimated at $273,237, approximately $150 per square foot. 324 E 22nd St is a home located in Ashtabula County with nearby schools including Lakeside High School and Christian Faith Academy.
Ownership History
Date
Name
Owned For
Owner Type
Purchase Details
Closed on
Dec 7, 2005
Sold by
Robison David L and Robison Rebecca L
Bought by
Pugliese August A and Graeb Elizabeth P
Current Estimated Value
Home Financials for this Owner
Home Financials are based on the most recent Mortgage that was taken out on this home.
Original Mortgage
$151,650
Outstanding Balance
$85,804
Interest Rate
6.48%
Mortgage Type
Fannie Mae Freddie Mac
Estimated Equity
$187,433
Purchase Details
Closed on
May 5, 2000
Sold by
Futura Developments Ltd
Bought by
Robison David L
Home Financials for this Owner
Home Financials are based on the most recent Mortgage that was taken out on this home.
Original Mortgage
$140,400
Interest Rate
8.24%
Mortgage Type
New Conventional
Purchase Details
Closed on
Sep 15, 1997
Sold by
Savarise William E
Bought by
Harley Brett J
Create a Home Valuation Report for This Property
The Home Valuation Report is an in-depth analysis detailing your home's value as well as a comparison with similar homes in the area
Home Values in the Area
Average Home Value in this Area
Purchase History
| Date | Buyer | Sale Price | Title Company |
|---|---|---|---|
| Pugliese August A | $165,500 | Chicago Title | |
| Robison David L | $156,000 | -- | |
| Harley Brett J | $19,000 | -- |
Source: Public Records
Mortgage History
| Date | Status | Borrower | Loan Amount |
|---|---|---|---|
| Open | Pugliese August A | $151,650 | |
| Closed | Robison David L | $140,400 |
Source: Public Records
Tax History
| Year | Tax Paid | Tax Assessment Tax Assessment Total Assessment is a certain percentage of the fair market value that is determined by local assessors to be the total taxable value of land and additions on the property. | Land | Improvement |
|---|---|---|---|---|
| 2024 | $6,835 | $79,560 | $7,110 | $72,450 |
| 2023 | $3,882 | $79,560 | $7,110 | $72,450 |
| 2022 | $3,170 | $57,230 | $5,460 | $51,770 |
| 2021 | $3,198 | $57,230 | $5,460 | $51,770 |
| 2020 | $3,246 | $57,230 | $5,460 | $51,770 |
| 2019 | $3,817 | $58,420 | $6,440 | $51,980 |
| 2018 | $3,479 | $58,420 | $6,440 | $51,980 |
| 2017 | $3,474 | $58,420 | $6,440 | $51,980 |
| 2016 | $3,323 | $53,100 | $5,850 | $47,250 |
| 2015 | $3,241 | $53,100 | $5,850 | $47,250 |
| 2014 | $3,156 | $53,100 | $5,850 | $47,250 |
| 2013 | $3,234 | $58,520 | $7,910 | $50,610 |
Source: Public Records
Map
Nearby Homes
- 919 E 17th St
- 0 Scott Ave Unit 5167555
- V/L W 12
- 0 E 23rd St Unit 5187222
- Carpenter W 19th Rd
- 1728 W 10th St
- 1331 E 28th St
- 1820 W 10th St
- 1028 Ohio Ave
- 1010 Ohio Ave
- 1031 Thayer Ave
- 1128 Myrtle Ave
- 505 W 36th St
- 3033 Avon Blvd
- 1712 W 6th St
- 705 W 35th St
- 622 W 35th St
- 814 Richards Ave
- 3829 Lake Ave
- 3835 Lake Ave
Your Personal Tour Guide
Ask me questions while you tour the home.