Estimated Value: $576,000 - $700,000
3
Beds
2
Baths
1,607
Sq Ft
$386/Sq Ft
Est. Value
About This Home
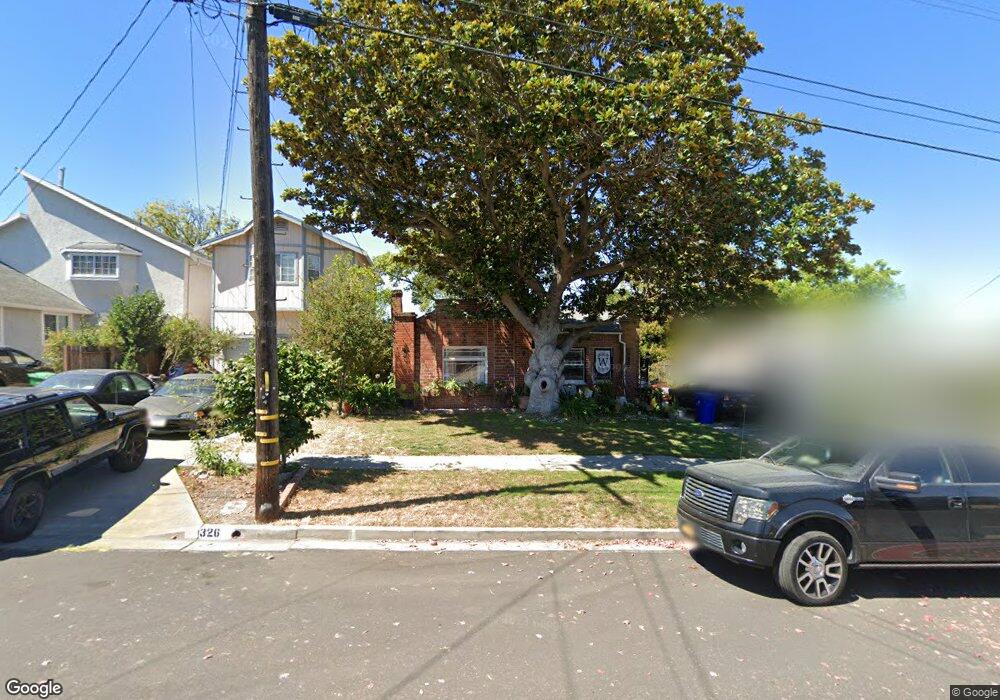
This home is located at 324 Harris Ave, Rodeo, CA 94572 and is currently estimated at $619,679, approximately $385 per square foot. 324 Harris Ave is a home located in Contra Costa County with nearby schools including Rodeo Hills Elementary School, Carquinez Middle School, and John Swett High School.
Ownership History
Date
Name
Owned For
Owner Type
Purchase Details
Closed on
Nov 18, 2005
Sold by
Whitt Walter and Whitt Yolanda
Bought by
Whitt Walter and Whitt Yolanda
Current Estimated Value
Purchase Details
Closed on
Mar 29, 2001
Sold by
Silva Kenneth J and Silva Kimberly R
Bought by
Whitt Walter and Whitt Yolanda
Home Financials for this Owner
Home Financials are based on the most recent Mortgage that was taken out on this home.
Original Mortgage
$197,600
Outstanding Balance
$83,439
Interest Rate
8.99%
Mortgage Type
Purchase Money Mortgage
Estimated Equity
$536,240
Create a Home Valuation Report for This Property
The Home Valuation Report is an in-depth analysis detailing your home's value as well as a comparison with similar homes in the area
Home Values in the Area
Average Home Value in this Area
Purchase History
| Date | Buyer | Sale Price | Title Company |
|---|---|---|---|
| Whitt Walter | -- | Financial Title | |
| Whitt Walter | $247,000 | North American Title Co |
Source: Public Records
Mortgage History
| Date | Status | Borrower | Loan Amount |
|---|---|---|---|
| Open | Whitt Walter | $197,600 | |
| Closed | Whitt Walter | $49,400 |
Source: Public Records
Tax History Compared to Growth
Tax History
| Year | Tax Paid | Tax Assessment Tax Assessment Total Assessment is a certain percentage of the fair market value that is determined by local assessors to be the total taxable value of land and additions on the property. | Land | Improvement |
|---|---|---|---|---|
| 2025 | $5,791 | $372,164 | $195,878 | $176,286 |
| 2024 | $5,729 | $364,868 | $192,038 | $172,830 |
| 2023 | $5,729 | $357,715 | $188,273 | $169,442 |
| 2022 | $5,594 | $350,702 | $184,582 | $166,120 |
| 2021 | $5,491 | $343,826 | $180,963 | $162,863 |
| 2019 | $5,357 | $333,631 | $175,597 | $158,034 |
| 2018 | $5,215 | $327,090 | $172,154 | $154,936 |
| 2017 | $5,121 | $320,678 | $168,779 | $151,899 |
| 2016 | $4,491 | $294,500 | $155,001 | $139,499 |
| 2015 | $4,352 | $281,000 | $147,896 | $133,104 |
| 2014 | $3,466 | $202,500 | $106,580 | $95,920 |
Source: Public Records
Map
Nearby Homes