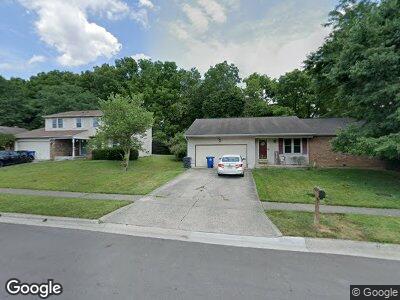
324 Highbury Crescent Columbus, OH 43230
Estimated Value: $303,355 - $349,000
3
Beds
2
Baths
1,506
Sq Ft
$218/Sq Ft
Est. Value
About This Home
This home is located at 324 Highbury Crescent, Columbus, OH 43230 and is currently estimated at $327,839, approximately $217 per square foot. 324 Highbury Crescent is a home located in Franklin County with nearby schools including Chapelfield Elementary School, Gahanna West Middle School, and Lincoln High School.
Ownership History
Date
Name
Owned For
Owner Type
Purchase Details
Closed on
Jan 31, 2002
Sold by
Bower Jeffrey A and Bower Cheryl S
Bought by
Herzog Daniel R
Current Estimated Value
Home Financials for this Owner
Home Financials are based on the most recent Mortgage that was taken out on this home.
Original Mortgage
$120,650
Interest Rate
7.23%
Mortgage Type
Purchase Money Mortgage
Purchase Details
Closed on
Apr 25, 1996
Sold by
Fuller Robert D
Bought by
Bower Jeffrey A and Bower Cheryl S
Home Financials for this Owner
Home Financials are based on the most recent Mortgage that was taken out on this home.
Original Mortgage
$96,800
Interest Rate
7.91%
Mortgage Type
Balloon
Purchase Details
Closed on
Jul 2, 1990
Purchase Details
Closed on
Jul 1, 1980
Create a Home Valuation Report for This Property
The Home Valuation Report is an in-depth analysis detailing your home's value as well as a comparison with similar homes in the area
Home Values in the Area
Average Home Value in this Area
Purchase History
| Date | Buyer | Sale Price | Title Company |
|---|---|---|---|
| Herzog Daniel R | $127,000 | -- | |
| Bower Jeffrey A | $101,900 | -- | |
| -- | $81,000 | -- | |
| -- | $55,200 | -- |
Source: Public Records
Mortgage History
| Date | Status | Borrower | Loan Amount |
|---|---|---|---|
| Open | Herzog Daniel R | $110,610 | |
| Closed | Herzog Daniel R | $20,000 | |
| Closed | Herzog Daniel R | $122,500 | |
| Closed | Herzog Daniel R | $120,650 | |
| Previous Owner | Bower Jeffrey A | $96,800 |
Source: Public Records
Tax History Compared to Growth
Tax History
| Year | Tax Paid | Tax Assessment Tax Assessment Total Assessment is a certain percentage of the fair market value that is determined by local assessors to be the total taxable value of land and additions on the property. | Land | Improvement |
|---|---|---|---|---|
| 2024 | $5,079 | $86,210 | $24,360 | $61,850 |
| 2023 | $5,015 | $86,205 | $24,360 | $61,845 |
| 2022 | $4,634 | $62,060 | $15,680 | $46,380 |
| 2021 | $4,482 | $62,060 | $15,680 | $46,380 |
| 2020 | $4,445 | $62,060 | $15,680 | $46,380 |
| 2019 | $3,726 | $51,910 | $13,090 | $38,820 |
| 2018 | $3,503 | $51,910 | $13,090 | $38,820 |
| 2017 | $3,419 | $51,910 | $13,090 | $38,820 |
| 2016 | $3,304 | $45,680 | $12,810 | $32,870 |
| 2015 | $3,307 | $45,680 | $12,810 | $32,870 |
| 2014 | $3,281 | $45,680 | $12,810 | $32,870 |
| 2013 | $1,629 | $45,675 | $12,810 | $32,865 |
Source: Public Records
Map
Nearby Homes
- 239 Chapelfield Rd
- 252 Cotswold Place
- 112-114 North St
- 3610 N Stygler Rd
- 144 Shepard St
- 421 Canterwood Ct
- 449 Lily Pond Ct
- 232 Regents Rd
- 364 Morgan Ln
- 642 Ridenour Rd
- 552 Fairholme Rd
- 573 Fairholme Rd
- 697 Woodmark Run
- 543 Tall Oaks Dr
- 356 Carpenter Rd
- 557 Tall Oaks Dr
- 219 N Hamilton Rd
- 603 Fenchurch Way
- 447 Woodside Lake Dr
- 144 Serran Dr
- 324 Highbury Crescent
- 330 Highbury Crescent
- 166 Chapelfield Rd
- 338 Highbury Crescent
- 181 Exton Ct
- 313 Highbury Crescent
- 346 Highbury Crescent
- 159 Chapelfield Rd
- 294 Highbury Crescent
- 189 Exton Ct
- 190 Chapelfield Rd
- 147 Chapelfield Rd
- 345 Highbury Crescent
- 139 Chapelfield Rd
- 293 Highbury Crescent
- 354 Highbury Crescent
- 198 Chapelfield Rd
- 195 Exton Ct
- 190 Exton Ct
- 191 Chapelfield Rd