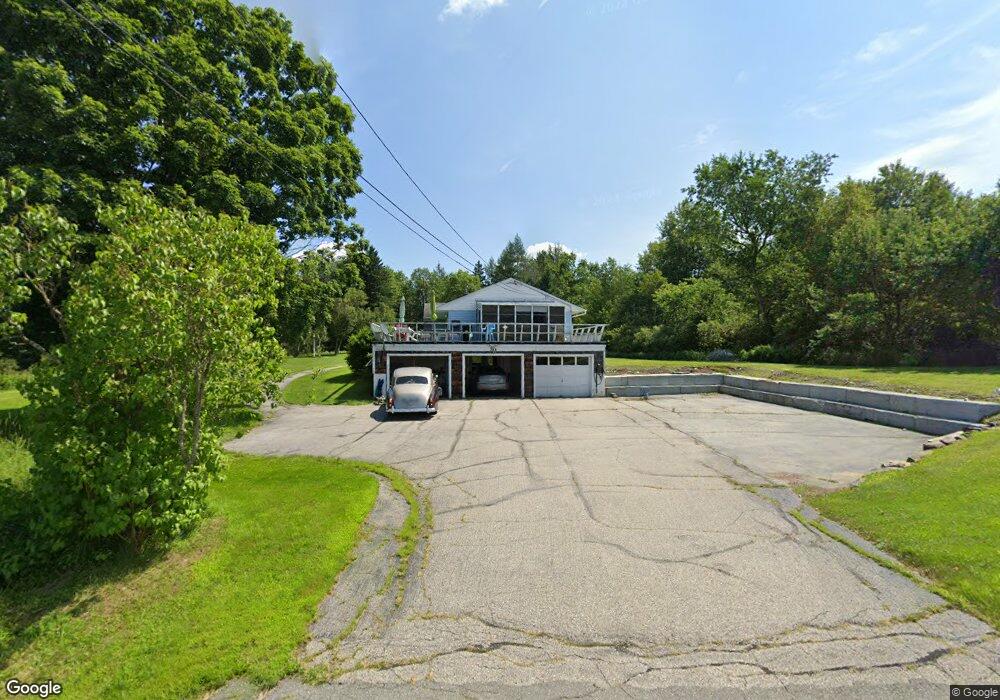
324 North Rd Lancaster, NH 03584
Estimated Value: $133,000 - $247,000
1
Bed
1
Bath
923
Sq Ft
$206/Sq Ft
Est. Value
About This Home
This home is located at 324 North Rd, Lancaster, NH 03584 and is currently estimated at $190,217, approximately $206 per square foot. 324 North Rd is a home located in Coos County with nearby schools including Lancaster Elementary School, White Mountains Regional High School, and Sunny Brook Montessori School.
Ownership History
Date
Name
Owned For
Owner Type
Purchase Details
Closed on
Aug 7, 1998
Sold by
Est Martin Helen S
Bought by
Mcfarland Andrew T
Current Estimated Value
Home Financials for this Owner
Home Financials are based on the most recent Mortgage that was taken out on this home.
Original Mortgage
$36,000
Outstanding Balance
$7,510
Interest Rate
6.92%
Estimated Equity
$182,707
Create a Home Valuation Report for This Property
The Home Valuation Report is an in-depth analysis detailing your home's value as well as a comparison with similar homes in the area
Home Values in the Area
Average Home Value in this Area
Purchase History
| Date | Buyer | Sale Price | Title Company |
|---|---|---|---|
| Mcfarland Andrew T | $40,000 | -- | |
| Mcfarland Andrew T | $40,000 | -- |
Source: Public Records
Mortgage History
| Date | Status | Borrower | Loan Amount |
|---|---|---|---|
| Open | Mcfarland Andrew T | $36,000 | |
| Closed | Mcfarland Andrew T | $36,000 |
Source: Public Records
Tax History Compared to Growth
Tax History
| Year | Tax Paid | Tax Assessment Tax Assessment Total Assessment is a certain percentage of the fair market value that is determined by local assessors to be the total taxable value of land and additions on the property. | Land | Improvement |
|---|---|---|---|---|
| 2024 | $2,687 | $140,100 | $42,800 | $97,300 |
| 2023 | $2,368 | $136,800 | $39,500 | $97,300 |
| 2022 | $1,907 | $78,500 | $19,800 | $58,700 |
| 2021 | $2,056 | $78,500 | $19,800 | $58,700 |
| 2020 | $1,942 | $78,500 | $19,800 | $58,700 |
| 2019 | $1,955 | $78,500 | $19,800 | $58,700 |
| 2018 | $2,054 | $78,500 | $19,800 | $58,700 |
| 2017 | $1,968 | $74,700 | $19,800 | $54,900 |
| 2016 | $1,913 | $74,700 | $19,800 | $54,900 |
| 2015 | $2,054 | $74,700 | $19,800 | $54,900 |
| 2014 | $1,748 | $74,700 | $19,800 | $54,900 |
| 2013 | $1,744 | $74,700 | $19,800 | $54,900 |
Source: Public Records
Map
Nearby Homes
- 86 & 90 Garland Rd
- 86 & 89 Garland Rd
- 0 Garland Rd Unit 38
- 19 Great Rock Rd
- 140 Middle St
- Lot 82 Portland St
- Lot 2 Portland St
- 435 North Rd
- 218 Portland St
- 90 Bunker Hill St
- 8 Richardson St
- Lot 26 Hartco Ave
- Lot 21 Hartco Ave
- Lot 11 Hartco Ave
- Lot 14 Hartco Ave
- Lot 9 Hartco Ave
- Lot 24 Hartco Ave
- Lot 23 Hartco Ave
- Lot 17 Hartco Ave
- Lot 20 Hartco Ave