Estimated Value: $201,000 - $216,000
2
Beds
2
Baths
1,267
Sq Ft
$164/Sq Ft
Est. Value
About This Home
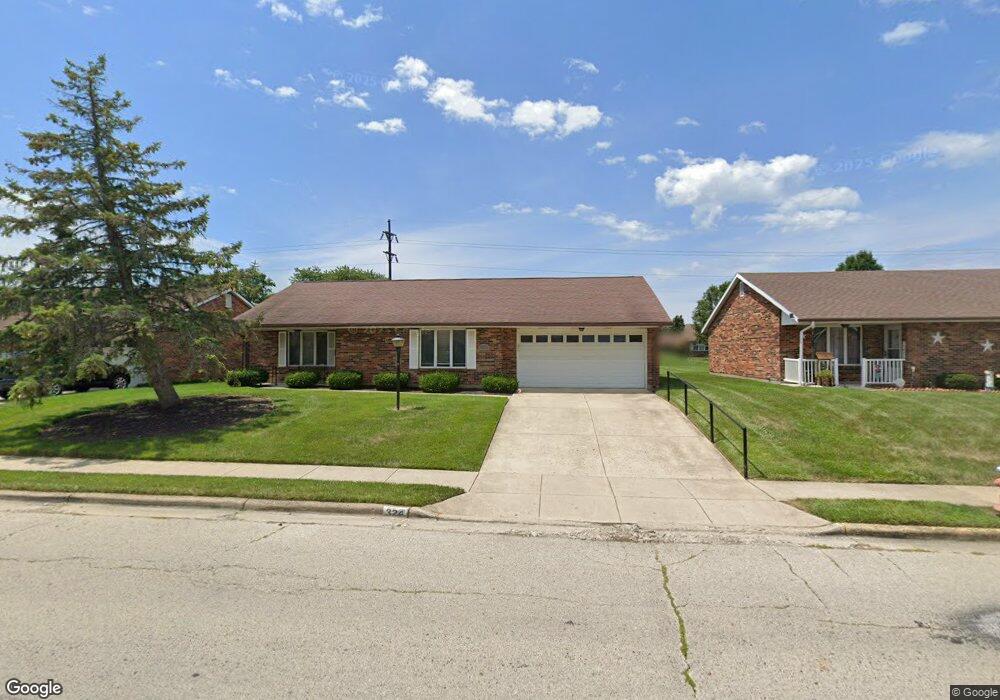
This home is located at 324 Westview Dr, Piqua, OH 45356 and is currently estimated at $208,242, approximately $164 per square foot. 324 Westview Dr is a home located in Miami County with nearby schools including Washington Primary School, Piqua Junior High School, and Piqua High School.
Ownership History
Date
Name
Owned For
Owner Type
Purchase Details
Closed on
Dec 30, 2021
Sold by
Roth James R and Estate Of Annabdlle M Roth
Bought by
Fox Brody Thomas and Fox Brody T
Current Estimated Value
Home Financials for this Owner
Home Financials are based on the most recent Mortgage that was taken out on this home.
Original Mortgage
$133,500
Outstanding Balance
$122,940
Interest Rate
3.05%
Mortgage Type
New Conventional
Estimated Equity
$85,302
Purchase Details
Closed on
May 14, 2015
Sold by
Gehle Mitchell F
Bought by
Roth Anabelle
Purchase Details
Closed on
Nov 3, 2009
Sold by
Rapp Bernice
Bought by
Gehle Mitchell F
Home Financials for this Owner
Home Financials are based on the most recent Mortgage that was taken out on this home.
Original Mortgage
$68,600
Interest Rate
4.9%
Mortgage Type
New Conventional
Purchase Details
Closed on
Sep 21, 1992
Bought by
Rapp Bernice
Create a Home Valuation Report for This Property
The Home Valuation Report is an in-depth analysis detailing your home's value as well as a comparison with similar homes in the area
Home Values in the Area
Average Home Value in this Area
Purchase History
| Date | Buyer | Sale Price | Title Company |
|---|---|---|---|
| Fox Brody Thomas | $150,000 | None Available | |
| Fox Brody Thomas | -- | Fite & Gutmann Co Lpa | |
| Roth Anabelle | $114,000 | Attorney | |
| Gehle Mitchell F | $85,750 | -- | |
| Rapp Bernice | $81,000 | -- |
Source: Public Records
Mortgage History
| Date | Status | Borrower | Loan Amount |
|---|---|---|---|
| Open | Fox Brody Thomas | $133,500 | |
| Closed | Fox Brody Thomas | $133,500 | |
| Previous Owner | Gehle Mitchell F | $68,600 |
Source: Public Records
Tax History Compared to Growth
Tax History
| Year | Tax Paid | Tax Assessment Tax Assessment Total Assessment is a certain percentage of the fair market value that is determined by local assessors to be the total taxable value of land and additions on the property. | Land | Improvement |
|---|---|---|---|---|
| 2024 | $1,851 | $49,950 | $10,890 | $39,060 |
| 2023 | $2,053 | $49,950 | $10,890 | $39,060 |
| 2022 | $2,088 | $49,950 | $10,890 | $39,060 |
| 2021 | $1,903 | $41,620 | $9,070 | $32,550 |
| 2020 | $1,865 | $41,620 | $9,070 | $32,550 |
| 2019 | $1,875 | $41,620 | $9,070 | $32,550 |
| 2018 | $1,708 | $36,200 | $9,070 | $27,130 |
| 2017 | $1,729 | $36,200 | $9,070 | $27,130 |
| 2016 | $1,710 | $36,200 | $9,070 | $27,130 |
| 2015 | $1,749 | $36,200 | $9,070 | $27,130 |
| 2014 | $1,749 | $36,200 | $9,070 | $27,130 |
| 2013 | $1,755 | $36,200 | $9,070 | $27,130 |
Source: Public Records
Map
Nearby Homes
- 413 Spotted Doe Trail
- 513 Spotted Doe Trail
- 1831 Wilshire Dr
- 1712 Park Ave
- 507 N Parkway Dr
- 1334 Maplewood Dr
- 0 Robert M Davis Pkwy
- 218 Lyndhurst Dr
- 1435 Covington Ave
- 1245 Severs Dr
- 8490 Bennett Dr
- 1319 Stratford Dr
- 4510 W State Route 185
- 1133 W Water St
- 806 Candlewood Blvd
- 1308 South St
- 1306 South St
- 279 Linden Ave
- 1110 South St
- 1115 Madison Ave
- 330 Westview Dr
- 318 Westview Dr
- 336 Westview Dr
- 405 Spotted Doe Ct
- 405 Spotted Doe Trail
- 323 Westview Dr
- 329 Westview Dr
- 342 Westview Dr
- 317 Westview Dr
- 2006 Piqua Clayton Rd
- 409 Spotted Doe Ct
- 335 Westview Dr
- 311 Westview Dr
- 348 Westview Dr
- 341 Westview Dr
- 413 Spotted Doe Ct
- 305 Westview Dr
- 404 Spotted Doe Ct
- 400 Westview Dr
- 2010 Piqua Clayton Rd