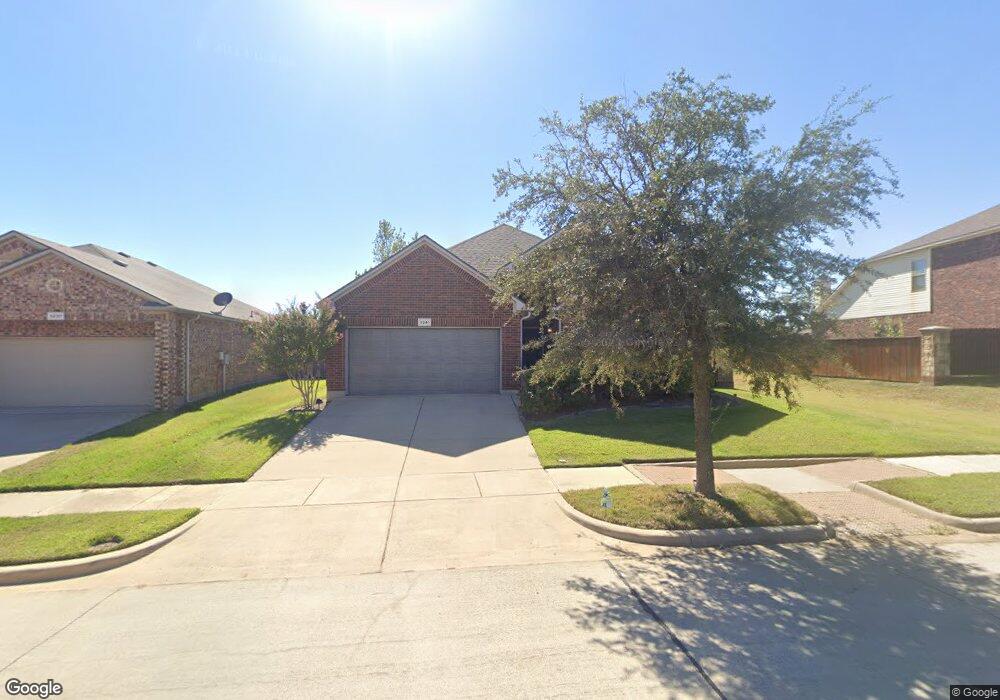
3241 Buckthorn Ln Argyle, TX 76226
Estimated Value: $404,832 - $435,000
4
Beds
3
Baths
2,721
Sq Ft
$154/Sq Ft
Est. Value
About This Home
This home is located at 3241 Buckthorn Ln, Argyle, TX 76226 and is currently estimated at $419,958, approximately $154 per square foot. 3241 Buckthorn Ln is a home located in Denton County with nearby schools including Hilltop Elementary School, Argyle ISD Sixth Grade Center, and Argyle Middle School.
Ownership History
Date
Name
Owned For
Owner Type
Purchase Details
Closed on
Jul 5, 2016
Sold by
Cantrell Jeffery and Cantrell Deborah
Bought by
Mullenix Derrick and Mullenix Christie
Current Estimated Value
Home Financials for this Owner
Home Financials are based on the most recent Mortgage that was taken out on this home.
Original Mortgage
$250,000
Outstanding Balance
$199,961
Interest Rate
3.64%
Mortgage Type
VA
Estimated Equity
$219,997
Purchase Details
Closed on
Jun 27, 2013
Sold by
Sirva Relocation Credit Llc
Bought by
Cantrell Jeffery and Cantrell Deborah
Purchase Details
Closed on
Jun 25, 2013
Sold by
Staples Kevin Thomas and Staples Laura Marie
Bought by
Sirva Relocation Credit Llc
Purchase Details
Closed on
Feb 27, 2009
Sold by
D R Horton Texas Ltd
Bought by
Staples Kevin Thomas and Staples Laura Marie
Home Financials for this Owner
Home Financials are based on the most recent Mortgage that was taken out on this home.
Original Mortgage
$181,160
Interest Rate
4.92%
Mortgage Type
FHA
Create a Home Valuation Report for This Property
The Home Valuation Report is an in-depth analysis detailing your home's value as well as a comparison with similar homes in the area
Home Values in the Area
Average Home Value in this Area
Purchase History
| Date | Buyer | Sale Price | Title Company |
|---|---|---|---|
| Mullenix Derrick | -- | Lawyers Title | |
| Cantrell Jeffery | -- | Stc | |
| Sirva Relocation Credit Llc | -- | Stc | |
| Staples Kevin Thomas | -- | None Available |
Source: Public Records
Mortgage History
| Date | Status | Borrower | Loan Amount |
|---|---|---|---|
| Open | Mullenix Derrick | $250,000 | |
| Previous Owner | Staples Kevin Thomas | $181,160 |
Source: Public Records
Tax History Compared to Growth
Tax History
| Year | Tax Paid | Tax Assessment Tax Assessment Total Assessment is a certain percentage of the fair market value that is determined by local assessors to be the total taxable value of land and additions on the property. | Land | Improvement |
|---|---|---|---|---|
| 2025 | -- | $401,771 | $103,584 | $298,187 |
| 2024 | $8,173 | $396,714 | $0 | $0 |
| 2023 | $7,077 | $360,649 | $103,584 | $323,979 |
| 2022 | $7,134 | $327,863 | $68,548 | $311,962 |
| 2021 | $6,659 | $298,057 | $54,838 | $243,219 |
| 2020 | $6,542 | $281,522 | $54,838 | $226,684 |
| 2019 | $6,883 | $283,119 | $54,838 | $228,281 |
| 2018 | $6,560 | $266,603 | $54,838 | $211,765 |
| 2017 | $6,535 | $261,211 | $54,838 | $206,373 |
| 2016 | $5,704 | $237,507 | $61,242 | $176,265 |
| 2015 | $5,706 | $224,500 | $36,745 | $187,755 |
| 2014 | $5,706 | $225,350 | $36,745 | $188,605 |
| 2013 | -- | $202,319 | $36,745 | $165,574 |
Source: Public Records
Map
Nearby Homes
- 3209 Buckthorn Ln
- 3228 Buckthorn Ln
- 3309 Stonecrop Trail
- 5104 Shady Grove Ln
- 3200 Hornbeam St
- 4509 Shagbark Dr
- 2913 Classical Dr
- 5109 Shady Grove Ln
- 3109 Emerald Trace Dr
- 3004 Emerald Trace Dr
- 3016 Emerald Trace Dr
- 2800 Emerald Trace Dr
- Primrose FE V Plan at Glenwood Meadows
- Spring Cress Plan at Glenwood Meadows
- Primrose FE VI Plan at Glenwood Meadows
- Primrose FE III Plan at Glenwood Meadows
- Magnolia III Plan at Glenwood Meadows
- Violet Plan at Glenwood Meadows
- Bellflower III Plan at Glenwood Meadows
- Carolina Plan at Glenwood Meadows
- 3237 Buckthorn Ln
- 3233 Buckthorn Ln
- 3301 Buckthorn Ln
- 3305 Buckthorn Ln
- 3229 Buckthorn Ln
- 3236 Buckthorn Ln
- 3309 Buckthorn Ln
- 3232 Buckthorn Ln
- 4524 Woodbine Rd
- 3225 Buckthorn Ln
- 4520 Woodbine Rd
- 3313 Buckthorn Ln
- 3308 Tamarack Ln
- 3312 Tamarack Ln
- 3300 Tamarack Ln
- 3317 Stonecrop Trail
- 3224 Buckthorn Ln
- 3221 Buckthorn Ln
- 3300 Tamarack Ln
- 3312 Tamarack Ln