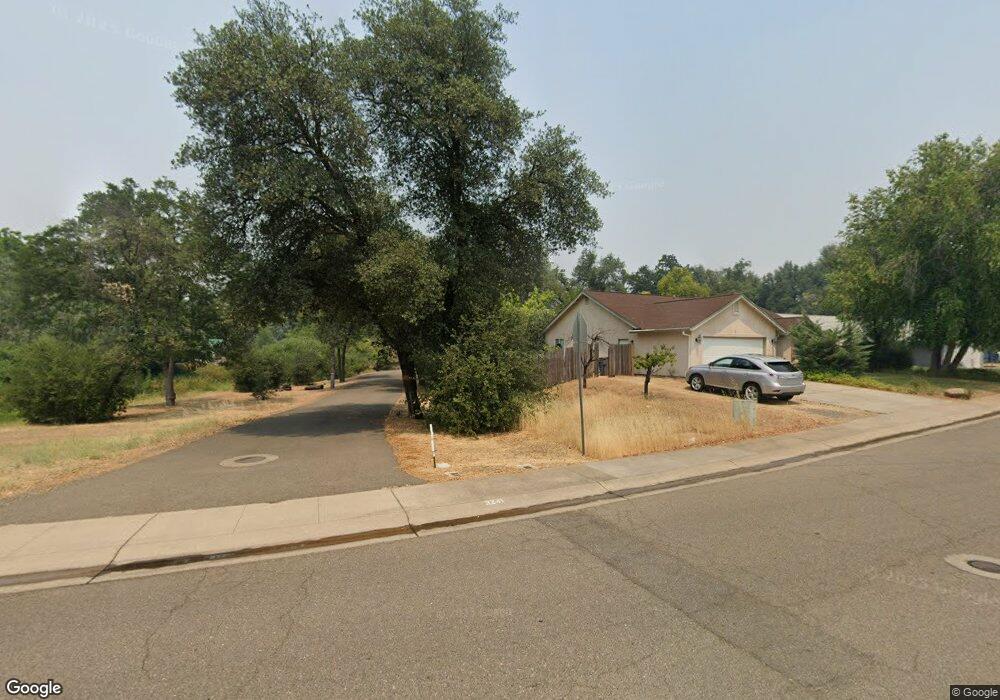
3241 Lawrence Rd Redding, CA 96002
Enterprise NeighborhoodEstimated Value: $393,000 - $455,721
4
Beds
2
Baths
1,865
Sq Ft
$231/Sq Ft
Est. Value
About This Home
This home is located at 3241 Lawrence Rd, Redding, CA 96002 and is currently estimated at $430,430, approximately $230 per square foot. 3241 Lawrence Rd is a home located in Shasta County with nearby schools including Rother Elementary School, Parsons Junior High School, and Enterprise High School.
Ownership History
Date
Name
Owned For
Owner Type
Purchase Details
Closed on
Aug 28, 2025
Sold by
Saefong Chanansiriruth
Bought by
Saefong Sen Ching
Current Estimated Value
Home Financials for this Owner
Home Financials are based on the most recent Mortgage that was taken out on this home.
Original Mortgage
$296,000
Outstanding Balance
$295,231
Interest Rate
6.75%
Mortgage Type
New Conventional
Estimated Equity
$135,199
Purchase Details
Closed on
Nov 20, 2019
Sold by
Hudson Merilee J and Hudson Declaration O Merilee J
Bought by
Rippey Scott and Rippey Albany
Home Financials for this Owner
Home Financials are based on the most recent Mortgage that was taken out on this home.
Original Mortgage
$300,000
Interest Rate
3.5%
Mortgage Type
New Conventional
Purchase Details
Closed on
May 3, 2007
Sold by
Zaidi Zia and Zaidi Shari
Bought by
Hudson Merilee J
Purchase Details
Closed on
May 2, 2007
Sold by
Zaidi Zia and Zaidi Shari
Bought by
Hudson Merilee J
Purchase Details
Closed on
Mar 23, 2006
Sold by
Fannon James L
Bought by
Zaidi Zia and Zaidi Shari
Create a Home Valuation Report for This Property
The Home Valuation Report is an in-depth analysis detailing your home's value as well as a comparison with similar homes in the area
Home Values in the Area
Average Home Value in this Area
Purchase History
| Date | Buyer | Sale Price | Title Company |
|---|---|---|---|
| Saefong Sen Ching | -- | First American Title | |
| Saefong Sen Ching | $370,000 | First American Title | |
| Rippey Scott | $375,000 | Placer Title Company | |
| Hudson Merilee J | $93,000 | Alliance Title Company | |
| Hudson Merilee J | $345,000 | Alliance Title Company | |
| Zaidi Zia | -- | Alliance Title Company |
Source: Public Records
Mortgage History
| Date | Status | Borrower | Loan Amount |
|---|---|---|---|
| Open | Saefong Sen Ching | $296,000 | |
| Previous Owner | Rippey Scott | $300,000 |
Source: Public Records
Tax History
| Year | Tax Paid | Tax Assessment Tax Assessment Total Assessment is a certain percentage of the fair market value that is determined by local assessors to be the total taxable value of land and additions on the property. | Land | Improvement |
|---|---|---|---|---|
| 2025 | $4,364 | $410,114 | $82,021 | $328,093 |
| 2024 | $4,302 | $402,073 | $80,413 | $321,660 |
| 2023 | $4,302 | $394,190 | $78,837 | $315,353 |
| 2022 | $4,179 | $386,462 | $77,292 | $309,170 |
| 2021 | $4,035 | $378,885 | $75,777 | $303,108 |
| 2020 | $4,018 | $375,000 | $75,000 | $300,000 |
| 2019 | $1,243 | $117,295 | $4,112 | $113,183 |
| 2018 | $1,227 | $114,996 | $4,032 | $110,964 |
| 2017 | $1,247 | $112,742 | $3,953 | $108,789 |
| 2016 | $1,165 | $110,532 | $3,876 | $106,656 |
| 2015 | $1,155 | $108,872 | $3,818 | $105,054 |
| 2014 | $1,145 | $106,741 | $3,744 | $102,997 |
Source: Public Records
Map
Nearby Homes
- 3178 Lawrence Rd
- 3283 Middleton Ln
- 3293 Middleton Ln
- 1091 Del Sol Place
- 1075 Le Brun Ln
- 2906 Regal Ave
- 2820 Alfreda Way
- 952 Camino Ct
- 1354 Harpole Rd
- 0 Churn Creek Rd Unit 25-496
- 0 Churn Creek Rd Unit 26-609
- 0 Churn Creek Rd Unit 25-5491
- 3087 Northwoods Way
- 3703 Harrow Ct
- 3527 Adams Ln
- 3428 Adams Ln
- 1556 Minor St
- 918 Parsons Dr
- 3466 Silverwood St
- 3425 Silverwood St
- 3279 Lawrence Rd
- 3287 Lawrence Rd
- 3271 Lawrence Rd
- 3295 Lawrence Rd
- 3263 Lawrence Rd
- 1414 Augustine Way
- Lot 89 Lawrence Rd
- 87,88,89 Lawrence Rd
- 3235/3241 Lawrence Rd
- 0 Lawrence Rd
- Lot 88 Lawrence Rd
- 3255 Lawrence Rd
- 3235 Lawrence Rd
- 3288 Lawrence Rd
- 3278 Lawrence Rd
- 3300 Lawrence Rd
- 3247 Lawrence Rd
- 1424 Augustine Way
- 3303 Lawrence Rd
- 3315 Meridian Dr
Your Personal Tour Guide
Ask me questions while you tour the home.