3241 N Redda Rd Fresno, CA 93737
McLane NeighborhoodEstimated Value: $416,000 - $475,000
3
Beds
2
Baths
1,540
Sq Ft
$288/Sq Ft
Est. Value
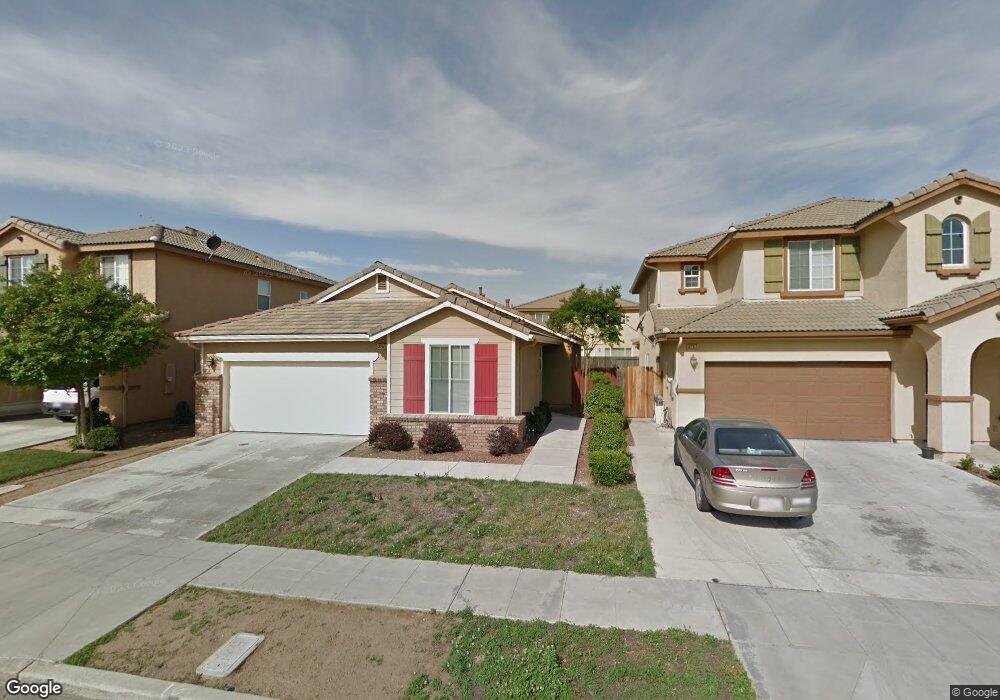
About This Home
This home is located at 3241 N Redda Rd, Fresno, CA 93737 and is currently estimated at $443,145, approximately $287 per square foot. 3241 N Redda Rd is a home located in Fresno County with nearby schools including Clovis Christian Schools.
Ownership History
Date
Name
Owned For
Owner Type
Purchase Details
Closed on
Dec 16, 2016
Sold by
Sanchez Daniel Carlos
Bought by
Sanchez Daniel Carlos and Sanchez Maria
Current Estimated Value
Home Financials for this Owner
Home Financials are based on the most recent Mortgage that was taken out on this home.
Original Mortgage
$194,000
Outstanding Balance
$90,875
Interest Rate
4.08%
Mortgage Type
New Conventional
Estimated Equity
$352,270
Purchase Details
Closed on
Sep 23, 2009
Sold by
Chant Peter
Bought by
Sanchez Daniel Carlos
Home Financials for this Owner
Home Financials are based on the most recent Mortgage that was taken out on this home.
Original Mortgage
$191,468
Interest Rate
4.88%
Mortgage Type
FHA
Purchase Details
Closed on
Feb 13, 2007
Sold by
Woodside Saratoga Sales Inc
Bought by
Chant Peter
Home Financials for this Owner
Home Financials are based on the most recent Mortgage that was taken out on this home.
Original Mortgage
$223,500
Interest Rate
6.19%
Mortgage Type
New Conventional
Create a Home Valuation Report for This Property
The Home Valuation Report is an in-depth analysis detailing your home's value as well as a comparison with similar homes in the area
Home Values in the Area
Average Home Value in this Area
Purchase History
| Date | Buyer | Sale Price | Title Company |
|---|---|---|---|
| Sanchez Daniel Carlos | -- | Netco Title Company | |
| Sanchez Daniel Carlos | $195,000 | First American Title Company | |
| Chant Peter | $298,000 | First American Title Company |
Source: Public Records
Mortgage History
| Date | Status | Borrower | Loan Amount |
|---|---|---|---|
| Open | Sanchez Daniel Carlos | $194,000 | |
| Previous Owner | Sanchez Daniel Carlos | $191,468 | |
| Previous Owner | Chant Peter | $223,500 |
Source: Public Records
Tax History Compared to Growth
Tax History
| Year | Tax Paid | Tax Assessment Tax Assessment Total Assessment is a certain percentage of the fair market value that is determined by local assessors to be the total taxable value of land and additions on the property. | Land | Improvement |
|---|---|---|---|---|
| 2025 | $3,161 | $251,698 | $77,442 | $174,256 |
| 2023 | $3,017 | $241,927 | $74,436 | $167,491 |
| 2022 | $2,965 | $237,184 | $72,977 | $164,207 |
| 2021 | $2,882 | $232,535 | $71,547 | $160,988 |
| 2020 | $2,838 | $230,152 | $70,814 | $159,338 |
| 2019 | $2,786 | $225,640 | $69,426 | $156,214 |
| 2018 | $2,743 | $221,216 | $68,065 | $153,151 |
| 2017 | $2,686 | $216,880 | $66,731 | $150,149 |
| 2016 | $2,599 | $212,628 | $65,423 | $147,205 |
| 2015 | $2,615 | $209,435 | $64,441 | $144,994 |
| 2014 | $2,723 | $205,333 | $63,179 | $142,154 |
Source: Public Records
Map
Nearby Homes
- 3044 N Jason Ave
- 7369 E Garland Ave
- 3036 N Clover Ave
- 2959 N Stanley Ave
- 2819 N Redda Rd
- 3514 Hornet Ave
- 2933 N Hornet Ave
- 6676 E Dayton Ave
- 3342 N Carriage Ave
- 2709 Pontiac Ave
- 2872 N Locan Ave
- 7063 E Brown Ave
- 3329 N Shelly Ave
- 3062 N Filbert Ave
- 7153 E Harvard Ave
- 1934 N Arroyo Ave
- 1918 N Arroyo Ave
- 1902 N Arroyo Ave
- 1926 N Arroyo Ave
- 1894 N Arroyo Ave
- 3227 N Redda Rd
- 3257 N Redda Rd
- 3213 N Redda Rd
- 3226 N Applegate Ave
- 3212 N Applegate Ave
- 3248 N Applegate Ave
- 3199 N Redda Rd
- 3262 N Applegate Ave
- 3240 N Redda Rd
- 3198 N Applegate Ave
- 3254 N Redda Rd
- 3226 N Redda Rd
- 3185 N Redda Rd
- 3212 N Redda Rd
- 7118 E Redlands Ave
- 7134 E Redlands Ave
- 3184 N Applegate Ave
- 3295 N Redda Rd
- 7106 E Redlands Ave
- 3295 Redda # 1035