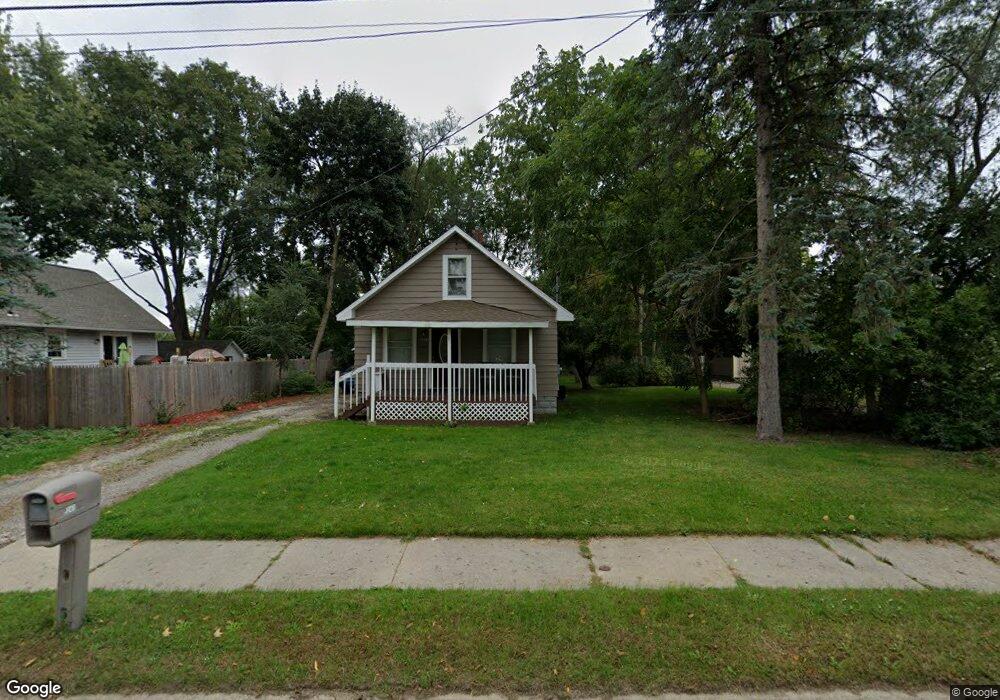
3241 W Mount Hope Ave Lansing, MI 48911
Moores River Drive NeighborhoodEstimated Value: $96,000 - $297,000
--
Bed
--
Bath
770
Sq Ft
$202/Sq Ft
Est. Value
About This Home
This home is located at 3241 W Mount Hope Ave, Lansing, MI 48911 and is currently estimated at $155,642, approximately $202 per square foot. 3241 W Mount Hope Ave is a home located in Ingham County with nearby schools including Averill Elementary School, Attwood School, and J.W. Sexton High School.
Ownership History
Date
Name
Owned For
Owner Type
Purchase Details
Closed on
Jun 1, 2010
Sold by
Reo Residential Holdings Llc
Bought by
Discover Group Llc
Current Estimated Value
Purchase Details
Closed on
Sep 22, 2009
Sold by
Deutsche Bank National Trust Company
Bought by
Reo Residential Holdings Llc
Purchase Details
Closed on
Apr 21, 2009
Sold by
Wiggins Shannon G and Abduljaber Mohamad H
Bought by
Deutsche Bank National Trust Company
Purchase Details
Closed on
Feb 5, 2009
Sold by
Wiggins Shannon G and Abduljaher Mohamad H
Bought by
Deutsche Bank National Trust Company
Purchase Details
Closed on
Jan 1, 1999
Sold by
Abdeljaber Hussein H
Bought by
Abdeljaber Mohmad H
Purchase Details
Closed on
Jan 1, 1998
Sold by
Abdeljaber Hussein H
Bought by
Cook David and Cook Regina
Purchase Details
Closed on
Sep 1, 1995
Purchase Details
Closed on
Jan 1, 1989
Sold by
Abdeljaber Huseim H
Bought by
Abduljaber Mohamad M
Create a Home Valuation Report for This Property
The Home Valuation Report is an in-depth analysis detailing your home's value as well as a comparison with similar homes in the area
Home Values in the Area
Average Home Value in this Area
Purchase History
| Date | Buyer | Sale Price | Title Company |
|---|---|---|---|
| Discover Group Llc | $6,000 | None Available | |
| Reo Residential Holdings Llc | $2,750 | Service Link | |
| Deutsche Bank National Trust Company | -- | None Available | |
| Deutsche Bank National Trust Company | $32,000 | None Available | |
| Abdeljaber Mohmad H | $19,000 | -- | |
| Cook David | $39,500 | -- | |
| -- | $55,000 | -- | |
| Abduljaber Mohamad M | $19,000 | -- |
Source: Public Records
Tax History Compared to Growth
Tax History
| Year | Tax Paid | Tax Assessment Tax Assessment Total Assessment is a certain percentage of the fair market value that is determined by local assessors to be the total taxable value of land and additions on the property. | Land | Improvement |
|---|---|---|---|---|
| 2025 | $2,354 | $52,600 | $14,800 | $37,800 |
| 2024 | $19 | $47,400 | $14,800 | $32,600 |
| 2023 | $2,216 | $41,500 | $14,800 | $26,700 |
| 2022 | $2,025 | $34,400 | $10,900 | $23,500 |
| 2021 | $1,979 | $31,500 | $9,500 | $22,000 |
| 2020 | $1,964 | $28,800 | $9,500 | $19,300 |
| 2019 | $3,409 | $26,700 | $9,500 | $17,200 |
| 2018 | $1,800 | $25,500 | $9,500 | $16,000 |
| 2017 | $1,964 | $25,500 | $9,500 | $16,000 |
| 2016 | $3,077 | $25,200 | $9,500 | $15,700 |
| 2015 | $3,077 | $22,300 | $18,954 | $3,346 |
| 2014 | $3,077 | $21,800 | $18,954 | $2,846 |
Source: Public Records
Map
Nearby Homes
- 3310 W Mount Hope Ave
- 3333 Moores River Dr Unit 812
- 3508 Muirfield Dr
- 3601 Muirfield Dr
- 3421 Troon Cir Unit 29
- 2201 Pamela Place
- 3416 Cooley Dr
- 2200 Rossiter Place
- 3425 Cooley Dr
- 3614 Cooley Dr
- 1533 Cambridge Rd
- 2505 Hanover Dr
- 2418 Rossiter Place
- 2710 Bedford Rd
- 3510 Christine Dr
- 3811 Cooley Dr
- 3214 Gingersnap Ln
- 2838 Sunderland Rd
- 2905 S Catherine St
- 4.5 Locust Ln
- 3237 W Mount Hope Ave
- 3235 W Mount Hope Ave
- 3225 W Mount Hope Ave
- 3201 S Cambridge Rd
- 3131 S Cambridge Rd
- 3201 W Mount Hope Ave
- 3123 S Cambridge Rd
- 3131 W Mount Hope Ave
- 3209 S Cambridge Rd
- 3105 S Cambridge Rd
- 3206 S Cambridge Rd
- 3215 W Mount Hope Ave
- 3121 W Mount Hope Ave
- 3313 W Mount Hope Ave
- 3118 S Cambridge Rd
- 3031 S Cambridge Rd
- 3215 S Cambridge Rd
- 3212 S Cambridge Rd
- 3025 S Cambridge Rd
- 3038 Westchester Rd