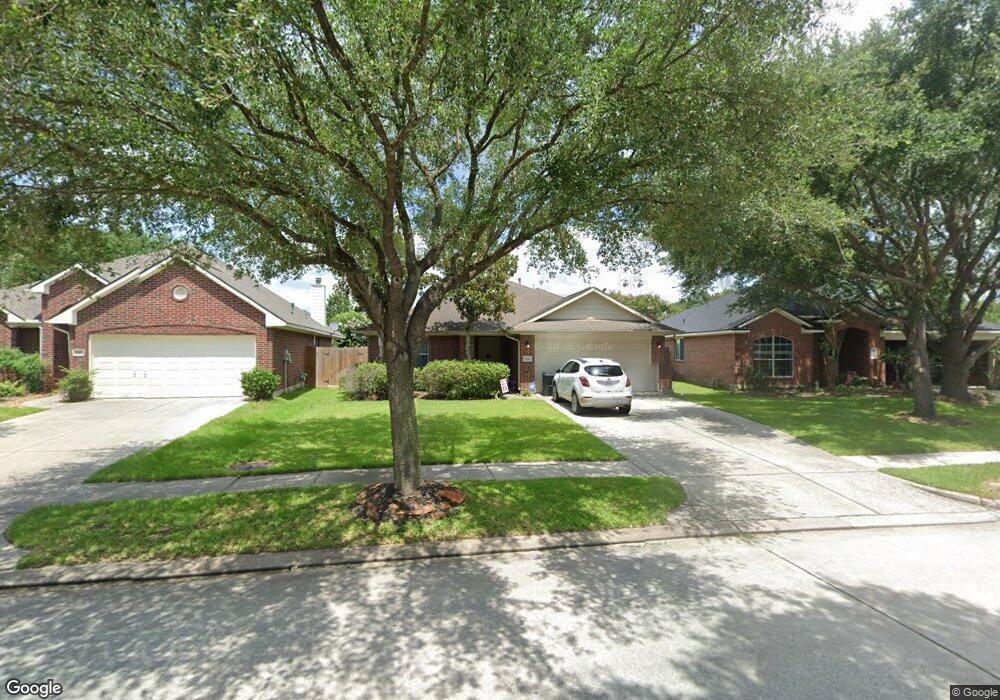
32411 Cross Spring Park Ln Conroe, TX 77385
Imperial Oaks NeighborhoodEstimated Value: $277,000 - $318,000
3
Beds
2
Baths
1,956
Sq Ft
$149/Sq Ft
Est. Value
About This Home
This home is located at 32411 Cross Spring Park Ln, Conroe, TX 77385 and is currently estimated at $291,960, approximately $149 per square foot. 32411 Cross Spring Park Ln is a home located in Montgomery County with nearby schools including Kaufman Elementary School, Vogel Intermediate School, and Irons J High School.
Ownership History
Date
Name
Owned For
Owner Type
Purchase Details
Closed on
Jul 28, 2010
Sold by
Collins John J and Collins Tiffany
Bought by
Ferritti Kristi S
Current Estimated Value
Home Financials for this Owner
Home Financials are based on the most recent Mortgage that was taken out on this home.
Original Mortgage
$128,272
Outstanding Balance
$85,739
Interest Rate
4.76%
Mortgage Type
FHA
Estimated Equity
$206,221
Purchase Details
Closed on
Dec 10, 2004
Sold by
J & S Imperial Oaks Ii Ltd
Bought by
Collins John J
Home Financials for this Owner
Home Financials are based on the most recent Mortgage that was taken out on this home.
Original Mortgage
$120,500
Interest Rate
5.64%
Mortgage Type
Purchase Money Mortgage
Purchase Details
Closed on
Sep 17, 2003
Sold by
Imperial Oaks No 3 Ltd
Bought by
Ferritti Kristi S
Create a Home Valuation Report for This Property
The Home Valuation Report is an in-depth analysis detailing your home's value as well as a comparison with similar homes in the area
Home Values in the Area
Average Home Value in this Area
Purchase History
| Date | Buyer | Sale Price | Title Company |
|---|---|---|---|
| Ferritti Kristi S | -- | First American Title | |
| Collins John J | -- | Stewart Title Of Montgomery | |
| Ferritti Kristi S | -- | -- |
Source: Public Records
Mortgage History
| Date | Status | Borrower | Loan Amount |
|---|---|---|---|
| Open | Ferritti Kristi S | $128,272 | |
| Previous Owner | Collins John J | $120,500 |
Source: Public Records
Tax History
| Year | Tax Paid | Tax Assessment Tax Assessment Total Assessment is a certain percentage of the fair market value that is determined by local assessors to be the total taxable value of land and additions on the property. | Land | Improvement |
|---|---|---|---|---|
| 2025 | $4,990 | $302,725 | $50,000 | $252,725 |
| 2024 | $4,561 | $278,432 | -- | -- |
| 2023 | $4,561 | $253,120 | $50,000 | $250,570 |
| 2022 | $5,880 | $230,110 | $23,500 | $248,480 |
| 2021 | $5,779 | $209,190 | $23,500 | $185,690 |
| 2020 | $5,782 | $200,470 | $23,500 | $176,970 |
| 2019 | $5,955 | $200,880 | $23,500 | $179,810 |
| 2018 | $4,784 | $182,620 | $23,500 | $159,120 |
| 2017 | $5,445 | $182,620 | $23,500 | $159,120 |
| 2016 | $5,388 | $180,720 | $23,500 | $157,220 |
| 2015 | $4,453 | $171,180 | $23,500 | $157,220 |
| 2014 | $4,453 | $155,620 | $23,500 | $132,120 |
Source: Public Records
Map
Nearby Homes
- 32315 Golden Oak Park Ln
- 31419 Fountainbrook Park Ln
- 2619 Winding Creek Way
- 31243 Quail Oak Park Ln
- 2611 Winding Creek Way
- 31410 Ashland Park Ln
- 2710 Fountainbrook Park Ct
- 2707 Oak Pass Ct
- 31831 Forest Park Trail
- 32510 Sweetgum Hollow Ct
- 31214 Windcrest Park Ln
- 31870 Forest Park Trail
- 2898 Woodland Glen Ln
- 32119 Archer Park
- 2643 Imperial Grove Ln
- 31878 Forest Park Trail
- 31903 Burnt Wood Ct
- 2511 Bridgestone Park Ln
- 2618 Bridgestone Park Ln
- 32514 Sweetgum Hollow Ct
- 32407 Cross Spring Park Ln
- 32415 Cross Spring Park Ln
- 32403 Cross Spring Park Ln
- 32503 Boulder Park Ct
- 32410 Cross Spring Park Ln
- 32507 Boulder Park Ct
- 32414 Cross Spring Park Ln
- 32406 Cross Spring Park Ln
- 32418 Cross Spring Park Ln
- 32402 Cross Spring Park Ln
- 32511 Boulder Park Ct
- 32343 Cross Spring Park Ln
- 32350 Cross Spring Park Ln
- 31623 Forest Oak Park Ct
- 31619 Forest Oak Park Ct
- 31631 Forest Oak Park Ct
- 2623 Camden Park Dr
- 31615 Forest Oak Park Ct
- 32515 Boulder Park Ct
- 32339 Cross Spring Park Ln
Your Personal Tour Guide
Ask me questions while you tour the home.