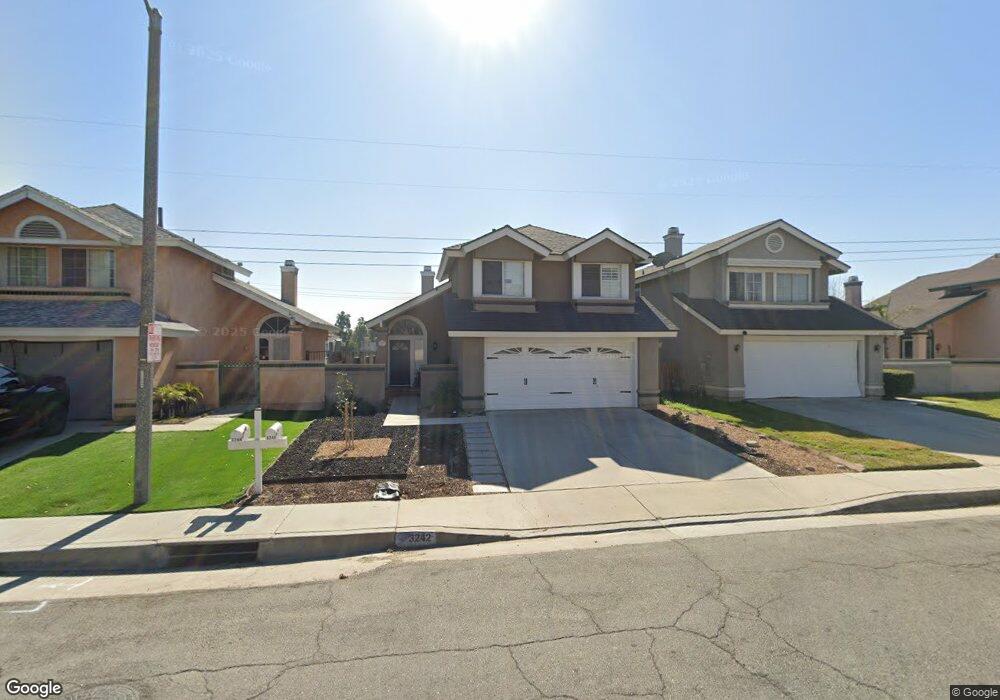
3242 Ashgate Way Ontario, CA 91761
Ontario Ranch NeighborhoodEstimated Value: $578,000 - $677,173
3
Beds
3
Baths
1,263
Sq Ft
$501/Sq Ft
Est. Value
About This Home
This home is located at 3242 Ashgate Way, Ontario, CA 91761 and is currently estimated at $632,543, approximately $500 per square foot. 3242 Ashgate Way is a home located in San Bernardino County with nearby schools including Creek View Elementary School, Grace Yokley Middle School, and Colony High.
Ownership History
Date
Name
Owned For
Owner Type
Purchase Details
Closed on
Jan 3, 2005
Sold by
Paige Lesa K
Bought by
Magdaleno Isabel
Current Estimated Value
Home Financials for this Owner
Home Financials are based on the most recent Mortgage that was taken out on this home.
Original Mortgage
$226,200
Outstanding Balance
$119,819
Interest Rate
6.5%
Mortgage Type
Purchase Money Mortgage
Estimated Equity
$512,724
Purchase Details
Closed on
Oct 28, 1997
Sold by
Phh Mtg Services Corp
Bought by
Paige Lesa K
Home Financials for this Owner
Home Financials are based on the most recent Mortgage that was taken out on this home.
Original Mortgage
$125,358
Interest Rate
7.23%
Mortgage Type
FHA
Purchase Details
Closed on
Jul 28, 1997
Sold by
Clark Michelle I
Bought by
Phh Mtg Services Corp
Purchase Details
Closed on
Sep 29, 1995
Sold by
Clark Michelle I
Bought by
Clark Michelle I and Clark Craig S
Create a Home Valuation Report for This Property
The Home Valuation Report is an in-depth analysis detailing your home's value as well as a comparison with similar homes in the area
Home Values in the Area
Average Home Value in this Area
Purchase History
| Date | Buyer | Sale Price | Title Company |
|---|---|---|---|
| Magdaleno Isabel | $348,000 | -- | |
| Paige Lesa K | -- | First American Title Ins | |
| Phh Mtg Services Corp | $158,502 | First American Title | |
| Clark Michelle I | -- | Chicago Title Co |
Source: Public Records
Mortgage History
| Date | Status | Borrower | Loan Amount |
|---|---|---|---|
| Open | Magdaleno Isabel | $226,200 | |
| Previous Owner | Paige Lesa K | $125,358 |
Source: Public Records
Tax History Compared to Growth
Tax History
| Year | Tax Paid | Tax Assessment Tax Assessment Total Assessment is a certain percentage of the fair market value that is determined by local assessors to be the total taxable value of land and additions on the property. | Land | Improvement |
|---|---|---|---|---|
| 2025 | $5,018 | $485,084 | $169,780 | $315,304 |
| 2024 | $5,018 | $475,573 | $166,451 | $309,122 |
| 2023 | $4,902 | $466,248 | $163,187 | $303,061 |
| 2022 | $4,814 | $457,106 | $159,987 | $297,119 |
| 2021 | $4,772 | $448,143 | $156,850 | $291,293 |
| 2020 | $4,685 | $443,548 | $155,242 | $288,306 |
| 2019 | $4,661 | $434,851 | $152,198 | $282,653 |
| 2018 | $4,185 | $392,400 | $137,500 | $254,900 |
| 2017 | $3,825 | $365,000 | $127,900 | $237,100 |
| 2016 | $3,668 | $347,600 | $121,800 | $225,800 |
| 2015 | $3,531 | $331,000 | $116,000 | $215,000 |
| 2014 | $3,282 | $311,000 | $109,000 | $202,000 |
Source: Public Records
Map
Nearby Homes
- 2620 S Montego
- 3117 S Genoa St Unit A
- 3938 E Cambria Privado
- 4211 E Malagon Privado Unit 66
- 4221 E Malagon Privado Unit 60
- 4101 S Wildflax Paseo
- 3122 Whitestag Rd
- 3104 Whitestag Rd
- 2943 Alder Creek Dr
- 3627 Oak Creek Dr
- 3635 Oak Creek Dr
- 3636 Oak Creek Dr Unit B
- 2456 S Woodlark Dr
- 3647 Oak Creek Dr Unit C
- 3268 S Agate Paseo
- 3332 S Lafayette Paseo Unit 103
- 3352 S Lafayette Paseo
- Plan Two at Neuhouse - Eave
- 3264 S Agate Paseo
- Plan Five at Neuhouse - Eave
- 3244 Ashgate Way
- 3240 Ashgate Way
- 3246 Ashgate Way
- 3238 Ashgate Way
- 3239 Ashgate Place
- 3248 Ashgate Way
- 3236 Ashgate Way
- 3241 Ashgate Way
- 3243 Ashgate Way
- 3234 Ashgate Way
- 3237 Ashgate Place
- 3250 Ashgate Ct
- 3245 Ashgate Way
- 3252 Ashgate Ct
- 3235 Ashgate Place
- 3232 Ashgate Way
- 3254 Ashgate Ct
- 3230 Ashgate Way
- 3227 Ashgate Place
- 3247 Ashgate Way