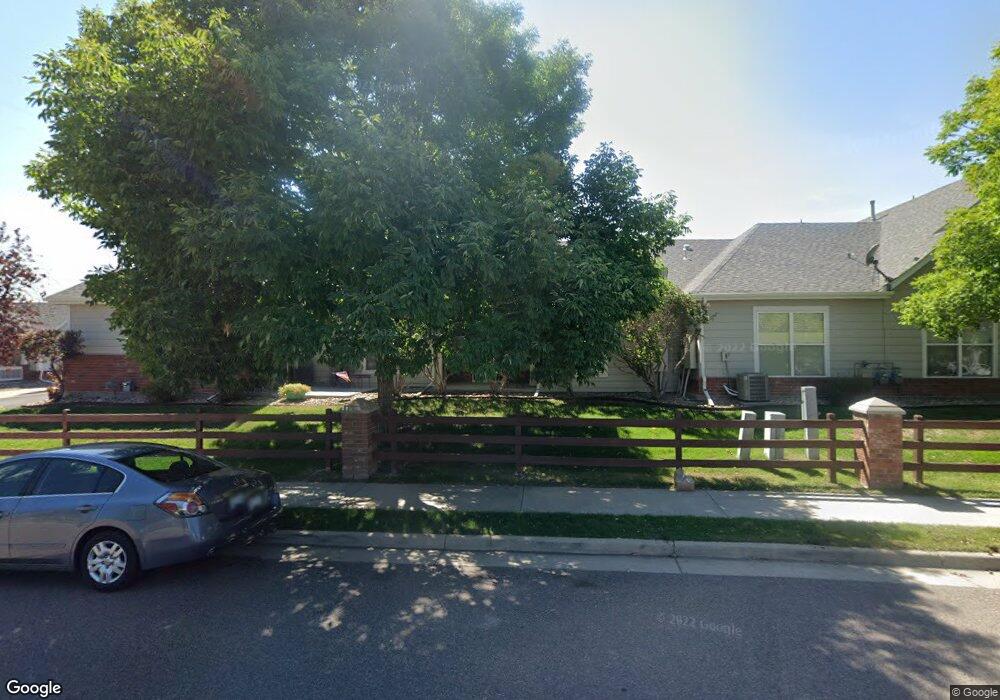
3243 E 102nd Dr Unit 3243 Thornton, CO 80229
Quimby NeighborhoodEstimated Value: $392,000 - $443,000
2
Beds
2
Baths
1,335
Sq Ft
$312/Sq Ft
Est. Value
About This Home
This home is located at 3243 E 102nd Dr Unit 3243, Thornton, CO 80229 and is currently estimated at $416,875, approximately $312 per square foot. 3243 E 102nd Dr Unit 3243 is a home located in Adams County with nearby schools including Trailside Academy.
Ownership History
Date
Name
Owned For
Owner Type
Purchase Details
Closed on
Aug 31, 2011
Sold by
Bauer Rodney
Bought by
Guerrero Julio and Guerrero Millie
Current Estimated Value
Home Financials for this Owner
Home Financials are based on the most recent Mortgage that was taken out on this home.
Original Mortgage
$170,050
Outstanding Balance
$118,214
Interest Rate
4.58%
Mortgage Type
New Conventional
Estimated Equity
$298,661
Purchase Details
Closed on
Jan 27, 2004
Sold by
Warren Charlotte
Bought by
Bauer Gladys D and Bauer Rodney
Home Financials for this Owner
Home Financials are based on the most recent Mortgage that was taken out on this home.
Original Mortgage
$152,000
Interest Rate
5%
Mortgage Type
Purchase Money Mortgage
Purchase Details
Closed on
Oct 13, 2000
Sold by
Callaway James W
Bought by
Callaway James W and Warren Charlotte
Home Financials for this Owner
Home Financials are based on the most recent Mortgage that was taken out on this home.
Original Mortgage
$117,424
Interest Rate
12.55%
Create a Home Valuation Report for This Property
The Home Valuation Report is an in-depth analysis detailing your home's value as well as a comparison with similar homes in the area
Home Values in the Area
Average Home Value in this Area
Purchase History
| Date | Buyer | Sale Price | Title Company |
|---|---|---|---|
| Guerrero Julio | $179,000 | Land Title Guarantee Company | |
| Bauer Gladys D | $190,000 | Land Title Guarantee Company | |
| Callaway James W | -- | -- | |
| Callaway James W | $146,780 | -- |
Source: Public Records
Mortgage History
| Date | Status | Borrower | Loan Amount |
|---|---|---|---|
| Open | Guerrero Julio | $170,050 | |
| Previous Owner | Bauer Gladys D | $152,000 | |
| Previous Owner | Callaway James W | $117,424 |
Source: Public Records
Tax History Compared to Growth
Tax History
| Year | Tax Paid | Tax Assessment Tax Assessment Total Assessment is a certain percentage of the fair market value that is determined by local assessors to be the total taxable value of land and additions on the property. | Land | Improvement |
|---|---|---|---|---|
| 2024 | $1,744 | $26,060 | $5,000 | $21,060 |
| 2023 | $1,730 | $29,020 | $3,310 | $25,710 |
| 2022 | $2,145 | $21,520 | $3,410 | $18,110 |
| 2021 | $2,023 | $21,520 | $3,410 | $18,110 |
| 2020 | $1,946 | $20,910 | $3,500 | $17,410 |
| 2019 | $1,957 | $20,910 | $3,500 | $17,410 |
| 2018 | $1,728 | $17,380 | $920 | $16,460 |
| 2017 | $1,693 | $17,380 | $920 | $16,460 |
| 2016 | $1,400 | $14,080 | $1,020 | $13,060 |
| 2015 | $1,224 | $14,080 | $1,020 | $13,060 |
| 2014 | -- | $14,320 | $1,020 | $13,300 |
Source: Public Records
Map
Nearby Homes
- 10316 Adams Place Unit 10316
- 3209 E 102nd Place Unit 3209
- 3242 E 103rd Dr Unit 608
- 3231 E 103rd Place Unit 308
- 2980 E 102nd Place
- 2691 E 102nd Place
- 2859 E 103rd Dr
- 2652 E 103rd Ave
- Meadow Plan at Arras Park - The Copper Collection
- Cascade Plan at Arras Park - The Durango Collection
- Alpine Plan at Arras Park - The Durango Collection
- Silverleaf Plan at Arras Park - The Summit Collection
- Flatiron Plan at Arras Park - The Summit Collection
- Princeton Plan at Arras Park - The Summit Collection
- Evergreen Plan at Arras Park - The Copper Collection
- Prospect Plan at Arras Park - The Durango Collection
- Breckenridge Plan at Arras Park - The Durango Collection
- Vista Plan at Arras Park - The Copper Collection
- Snowmass Plan at Arras Park - The Summit Collection
- Canyon Plan at Arras Park - The Copper Collection
- 3237 E 102nd Dr Unit 3237
- 3241 E 102nd Place Unit 3241
- 3233 E 102nd Dr Unit 3233
- 3239 E 102nd Place Unit 3239
- 3227 E 102nd Dr Unit 3227
- 3223 E 102nd Dr Unit 3223
- 3242 E 102nd Place Unit 3242
- 3216 E 102nd Dr Unit 3216
- 3221 E 102nd Place Unit 3221
- 3231 E 102nd Place Unit P15
- 3247 E 102nd Dr Unit 3247
- 10350 Cook Way Unit 10350
- 10340 Cook Way Unit 10340
- 3214 E 102nd Dr Unit 3214
- 3229 E 102nd Place Unit 3229
- 3238 E 102nd Place Unit 3238
- 3213 E 102nd Dr Unit 3213
- 3253 E 102nd Dr Unit 3253
- 3236 E 102nd Place Unit 3236
- 3257 E 102nd Dr Unit 3257