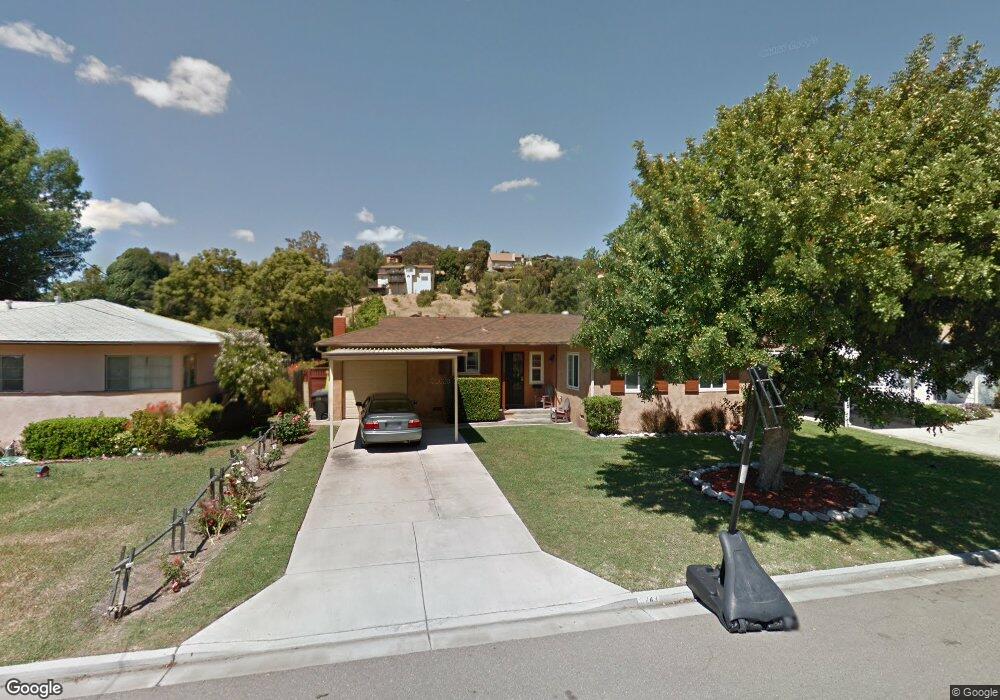
3243 Par Dr La Mesa, CA 91941
Estimated Value: $762,000 - $818,000
3
Beds
1
Bath
1,420
Sq Ft
$549/Sq Ft
Est. Value
About This Home
This home is located at 3243 Par Dr, La Mesa, CA 91941 and is currently estimated at $780,159, approximately $549 per square foot. 3243 Par Dr is a home located in San Diego County with nearby schools including Bancroft Elementary School, Spring Valley Middle School, and Mount Miguel High School.
Ownership History
Date
Name
Owned For
Owner Type
Purchase Details
Closed on
Aug 31, 2001
Sold by
Phillips Shawn E and Phillips John D
Bought by
Huber Ii Curtis N and Huber Nancy P
Current Estimated Value
Home Financials for this Owner
Home Financials are based on the most recent Mortgage that was taken out on this home.
Original Mortgage
$231,959
Outstanding Balance
$89,924
Interest Rate
6.91%
Mortgage Type
FHA
Estimated Equity
$690,235
Purchase Details
Closed on
Feb 15, 2000
Sold by
Mansfield Survivors Trust 09-07-94 and John W
Bought by
Phillips Shawn E and Phillips John D
Home Financials for this Owner
Home Financials are based on the most recent Mortgage that was taken out on this home.
Original Mortgage
$190,230
Interest Rate
8.38%
Mortgage Type
VA
Purchase Details
Closed on
Dec 8, 1998
Sold by
Mansfield Trust 09-07-94 and John W
Bought by
Mansfield John W
Purchase Details
Closed on
Sep 7, 1994
Sold by
Mansfield John W and Mansfield Anne K
Bought by
Mansfield John W and Mansfield Anne K
Create a Home Valuation Report for This Property
The Home Valuation Report is an in-depth analysis detailing your home's value as well as a comparison with similar homes in the area
Home Values in the Area
Average Home Value in this Area
Purchase History
| Date | Buyer | Sale Price | Title Company |
|---|---|---|---|
| Huber Ii Curtis N | $236,000 | Equity Title Company | |
| Phillips Shawn E | $186,500 | Commonwealth Land Title Co | |
| Mansfield John W | -- | -- | |
| Mansfield John W | -- | -- |
Source: Public Records
Mortgage History
| Date | Status | Borrower | Loan Amount |
|---|---|---|---|
| Open | Huber Ii Curtis N | $231,959 | |
| Previous Owner | Phillips Shawn E | $190,230 |
Source: Public Records
Tax History
| Year | Tax Paid | Tax Assessment Tax Assessment Total Assessment is a certain percentage of the fair market value that is determined by local assessors to be the total taxable value of land and additions on the property. | Land | Improvement |
|---|---|---|---|---|
| 2025 | $4,649 | $348,025 | $132,943 | $215,082 |
| 2024 | $4,649 | $341,202 | $130,337 | $210,865 |
| 2023 | $4,502 | $334,513 | $127,782 | $206,731 |
| 2022 | $4,427 | $327,955 | $125,277 | $202,678 |
| 2021 | $4,385 | $321,525 | $122,821 | $198,704 |
| 2020 | $4,209 | $318,229 | $121,562 | $196,667 |
| 2019 | $4,147 | $311,990 | $119,179 | $192,811 |
| 2018 | $4,022 | $305,874 | $116,843 | $189,031 |
| 2017 | $831 | $299,877 | $114,552 | $185,325 |
| 2016 | $3,781 | $293,998 | $112,306 | $181,692 |
| 2015 | $3,750 | $289,583 | $110,620 | $178,963 |
| 2014 | $3,683 | $283,912 | $108,454 | $175,458 |
Source: Public Records
Map
Nearby Homes
- 3355 Par Dr
- 8621 Golf Dr
- 3143 Lamar Ct
- 3451 Fairway Dr
- 3422 Trophy Dr
- 3448 Trophy Dr
- 8932 Troy St
- 3458 Central Ave
- 3580 Trophy Dr
- 8975 Lamar St
- 2707 Sweetwater Rd
- 8659 Valencia St Unit 1
- 8655 Valencia St
- 3221 Bancroft Dr Unit 24
- 8540 Vista Azul
- 8465 Broadway
- 8966 Arlingdale Way
- 2515 Sweetwater Rd Unit SPC 23
- 2515 Sweetwater Rd Unit 63
- 2515 Sweetwater Rd Unit 72
Your Personal Tour Guide
Ask me questions while you tour the home.