3243 S Normal Ave Unit 1 Chicago, IL 60616
Bridgeport NeighborhoodEstimated Value: $423,000 - $567,000
3
Beds
2
Baths
2,000
Sq Ft
$239/Sq Ft
Est. Value
About This Home
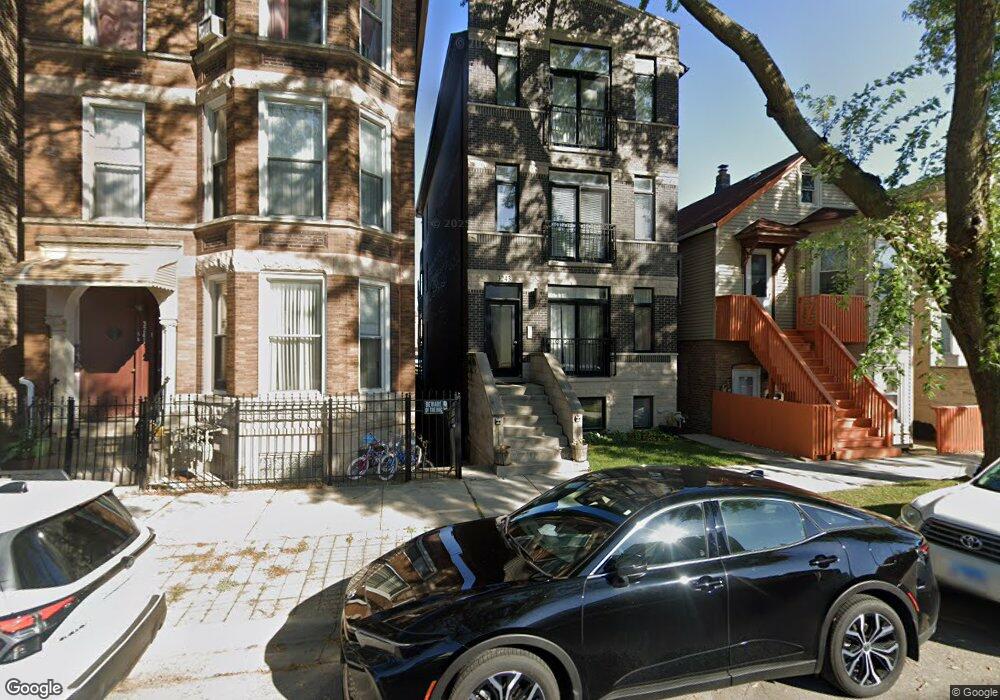
This home is located at 3243 S Normal Ave Unit 1, Chicago, IL 60616 and is currently estimated at $477,154, approximately $238 per square foot. 3243 S Normal Ave Unit 1 is a home located in Cook County with nearby schools including Healy Elementary School, Bridgeport Catholic Academy - South Campus, and Youth Connection Charter School.
Ownership History
Date
Name
Owned For
Owner Type
Purchase Details
Closed on
May 29, 2023
Sold by
Mitrani Samuel D C and Mitrani Del Toro
Bought by
Ocampo Karen Estrella and Urquiza Faoian
Current Estimated Value
Home Financials for this Owner
Home Financials are based on the most recent Mortgage that was taken out on this home.
Original Mortgage
$320,000
Outstanding Balance
$309,498
Interest Rate
6.08%
Mortgage Type
New Conventional
Estimated Equity
$167,656
Purchase Details
Closed on
Nov 27, 2019
Sold by
Jacobson Sherman P and Jacobson Kristen G
Bought by
Mitrani Samuel D and Deltoro Juanita Del
Home Financials for this Owner
Home Financials are based on the most recent Mortgage that was taken out on this home.
Original Mortgage
$320,000
Interest Rate
3.5%
Mortgage Type
New Conventional
Purchase Details
Closed on
Nov 30, 2012
Sold by
Lowe Avenue Project Llc
Bought by
Jacobson Kristen and Jacobson Sherman P
Home Financials for this Owner
Home Financials are based on the most recent Mortgage that was taken out on this home.
Original Mortgage
$216,000
Interest Rate
4%
Mortgage Type
New Conventional
Create a Home Valuation Report for This Property
The Home Valuation Report is an in-depth analysis detailing your home's value as well as a comparison with similar homes in the area
Home Values in the Area
Average Home Value in this Area
Purchase History
| Date | Buyer | Sale Price | Title Company |
|---|---|---|---|
| Ocampo Karen Estrella | $400,000 | Saturn Title | |
| Mitrani Samuel D | $370,000 | Chicago Title | |
| Jacobson Kristen | $240,000 | None Available |
Source: Public Records
Mortgage History
| Date | Status | Borrower | Loan Amount |
|---|---|---|---|
| Open | Ocampo Karen Estrella | $320,000 | |
| Previous Owner | Mitrani Samuel D | $320,000 | |
| Previous Owner | Jacobson Kristen | $216,000 |
Source: Public Records
Tax History
| Year | Tax Paid | Tax Assessment Tax Assessment Total Assessment is a certain percentage of the fair market value that is determined by local assessors to be the total taxable value of land and additions on the property. | Land | Improvement |
|---|---|---|---|---|
| 2025 | $8,517 | $44,069 | $7,110 | $36,959 |
| 2024 | $8,517 | $44,069 | $7,110 | $36,959 |
| 2023 | $8,552 | $43,685 | $5,740 | $37,945 |
| 2022 | $8,552 | $45,000 | $5,740 | $39,260 |
| 2021 | $8,379 | $44,998 | $5,739 | $39,259 |
| 2020 | $6,424 | $28,837 | $5,739 | $23,098 |
| 2019 | $6,484 | $32,272 | $5,739 | $26,533 |
| 2018 | $6,375 | $32,272 | $5,739 | $26,533 |
| 2017 | $6,600 | $30,660 | $4,565 | $26,095 |
| 2016 | $6,141 | $30,660 | $4,565 | $26,095 |
| 2015 | $5,618 | $30,660 | $4,565 | $26,095 |
| 2014 | $7,282 | $39,247 | $3,913 | $35,334 |
| 2013 | $7,138 | $39,247 | $3,913 | $35,334 |
Source: Public Records
Map
Nearby Homes
- 3214 S Canal St
- 3240 S Parnell Ave
- 3322 S Parnell Ave
- 3236 S Stewart Ave
- 3422 S Normal Ave
- 3415 S Wallace St
- 3206 S Lowe Ave
- 3225 S Union Ave
- 3017 S Canal St
- 356 W 31st St
- 3405 S Union Ave
- 3041 S Shields Ave Unit 503
- 3213 S Wells St Unit 1
- 3331 S Emerald Ave
- 3333 S Emerald Ave
- 642 W 35th St
- 3106 S Wells St Unit 1
- 3106 S Wells St Unit 3
- 654 W 31st St
- 238 W 31st St Unit 4E
- 3243 S Normal Ave
- 3243 S Normal Ave Unit 2
- 3243 S Normal Ave Unit 3
- 3243 S Normal Ave Unit 2
- 3243 S Normal Ave Unit 3
- 3243 S Normal Ave Unit 1
- 3241 S Normal Ave Unit 2
- 3241 S Normal Ave
- 3247 S Normal Ave
- 3247 S Normal Ave
- 3239 S Normal Ave Unit 1
- 3249 S Normal Ave
- 3235 S Normal Ave
- 3251 S Normal Ave
- 3253 S Normal Ave
- 3233 S Normal Ave
- 3233 S Normal Ave
- 3255 S Normal Ave
- 3231 S Normal Ave
- 3246 S Normal Ave Unit 1
Your Personal Tour Guide
Ask me questions while you tour the home.