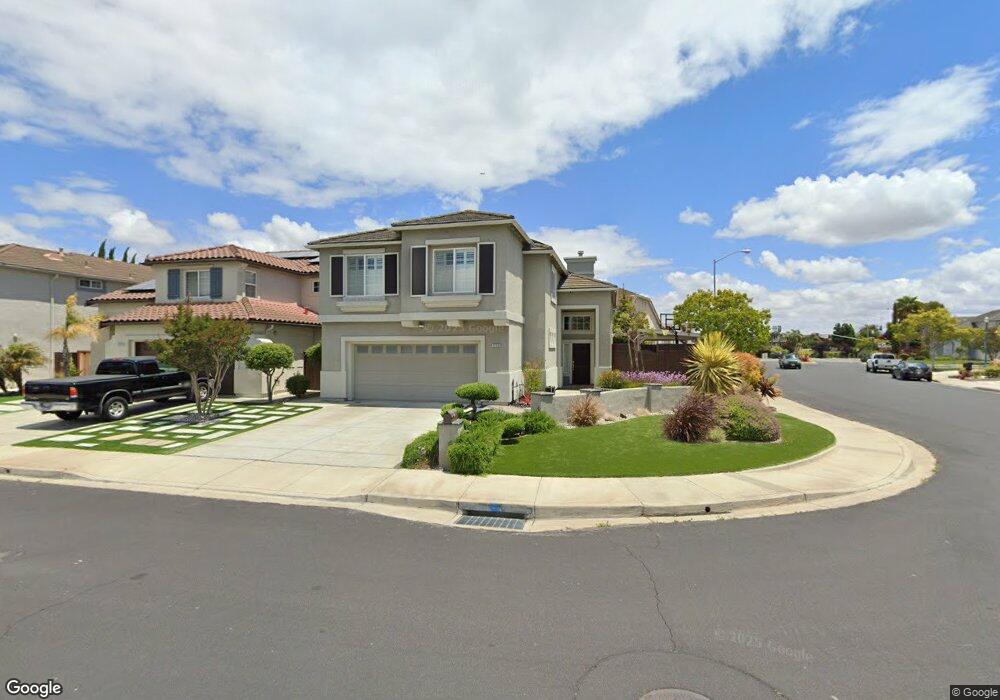
32439 Lighthouse Way Union City, CA 94587
Alvarado NeighborhoodEstimated Value: $1,579,000 - $1,760,000
4
Beds
3
Baths
1,895
Sq Ft
$880/Sq Ft
Est. Value
About This Home
This home is located at 32439 Lighthouse Way, Union City, CA 94587 and is currently estimated at $1,667,124, approximately $879 per square foot. 32439 Lighthouse Way is a home located in Alameda County with nearby schools including Delaine Eastin Elementary School, Itliong-Vera Cruz, and James Logan High School.
Ownership History
Date
Name
Owned For
Owner Type
Purchase Details
Closed on
Sep 22, 2023
Sold by
Vuong Steve Song and Revoca Gloria
Bought by
Sglee Separate Property Trust and Vuong
Current Estimated Value
Purchase Details
Closed on
Jun 16, 2021
Sold by
Vuong Steve Song and Lee Gloria Y
Bought by
Vuong Steve Song and Lee Gloria Y
Home Financials for this Owner
Home Financials are based on the most recent Mortgage that was taken out on this home.
Original Mortgage
$548,250
Interest Rate
2.9%
Mortgage Type
New Conventional
Purchase Details
Closed on
Jun 8, 2018
Sold by
Vuong Steve Song and Lee Gloria Y
Bought by
Vuong Steve Song and Lee Gloria Y
Purchase Details
Closed on
Aug 20, 2002
Sold by
Vuong Steve and Lee Gloria
Bought by
Vuong Steve and Lee Gloria
Home Financials for this Owner
Home Financials are based on the most recent Mortgage that was taken out on this home.
Original Mortgage
$300,700
Interest Rate
6.29%
Purchase Details
Closed on
Oct 14, 1999
Sold by
Standard Pacific Corp
Bought by
Vuong Steve and Lee Gloria
Home Financials for this Owner
Home Financials are based on the most recent Mortgage that was taken out on this home.
Original Mortgage
$324,900
Interest Rate
7.37%
Create a Home Valuation Report for This Property
The Home Valuation Report is an in-depth analysis detailing your home's value as well as a comparison with similar homes in the area
Home Values in the Area
Average Home Value in this Area
Purchase History
| Date | Buyer | Sale Price | Title Company |
|---|---|---|---|
| Sglee Separate Property Trust | -- | None Listed On Document | |
| Vuong Steve Song | -- | Amrock Inc | |
| Vuong Steve Song | -- | Amrock Inc | |
| Vuong Steve Song | -- | None Available | |
| Vuong Steve | -- | Alliance Title Company | |
| Vuong Steve | $406,500 | Chicago Title Co |
Source: Public Records
Mortgage History
| Date | Status | Borrower | Loan Amount |
|---|---|---|---|
| Previous Owner | Vuong Steve Song | $548,250 | |
| Previous Owner | Vuong Steve | $300,700 | |
| Previous Owner | Vuong Steve | $324,900 | |
| Closed | Vuong Steve | $40,600 |
Source: Public Records
Tax History Compared to Growth
Tax History
| Year | Tax Paid | Tax Assessment Tax Assessment Total Assessment is a certain percentage of the fair market value that is determined by local assessors to be the total taxable value of land and additions on the property. | Land | Improvement |
|---|---|---|---|---|
| 2025 | $9,864 | $680,057 | $187,346 | $499,711 |
| 2024 | $9,864 | $666,589 | $183,674 | $489,915 |
| 2023 | $9,548 | $653,383 | $180,073 | $480,310 |
| 2022 | $9,381 | $640,436 | $176,542 | $470,894 |
| 2021 | $9,172 | $627,745 | $173,082 | $461,663 |
| 2020 | $8,991 | $628,240 | $171,308 | $456,932 |
| 2019 | $9,077 | $615,925 | $167,950 | $447,975 |
| 2018 | $8,867 | $603,850 | $164,657 | $439,193 |
| 2017 | $8,655 | $592,012 | $161,429 | $430,583 |
| 2016 | $8,341 | $580,407 | $158,265 | $422,142 |
| 2015 | $8,184 | $571,690 | $155,888 | $415,802 |
| 2014 | $7,878 | $560,491 | $152,834 | $407,657 |
Source: Public Records
Map
Nearby Homes
- 32447 Pacific Grove Way
- 32425 Pacific Grove Way
- 32606 Singh Cir
- 32409 Elizabeth Way
- 4633 Granada Way
- 4501 Alice Way
- 32461 Darlene Way
- 4476 Madrid Ct
- 4639 Michelle Ct
- 32451 Regents Blvd
- 4263 Queen Anne Dr
- 4214 Saturn Way
- 4852 Nadine Ct
- 4167 Sunflower Ct
- 4532 Delores Dr
- 31226 Lily St
- 4210 Comet Cir
- 4243 Comet Cir
- 4231 Hanford St
- 4325 Horner St
- 32435 Lighthouse Way
- 32431 Lighthouse Way
- 32440 Pacific Grove Way
- 32436 Pacific Grove Way
- 5708 Jean Dr
- 32432 Pacific Grove Way
- 5712 Jean Dr
- 32440 Lighthouse Way
- 32436 Lighthouse Way
- 5704 Jean Dr
- 5816 Carmel Way
- 5812 Carmel Way
- 32432 Lighthouse Way
- 5808 Carmel Way
- 5716 Jean Dr
- 5804 Carmel Way
- 32428 Lighthouse Way
- 5800 Carmel Way
- 5720 Jean Dr
- 5721 Jean Dr