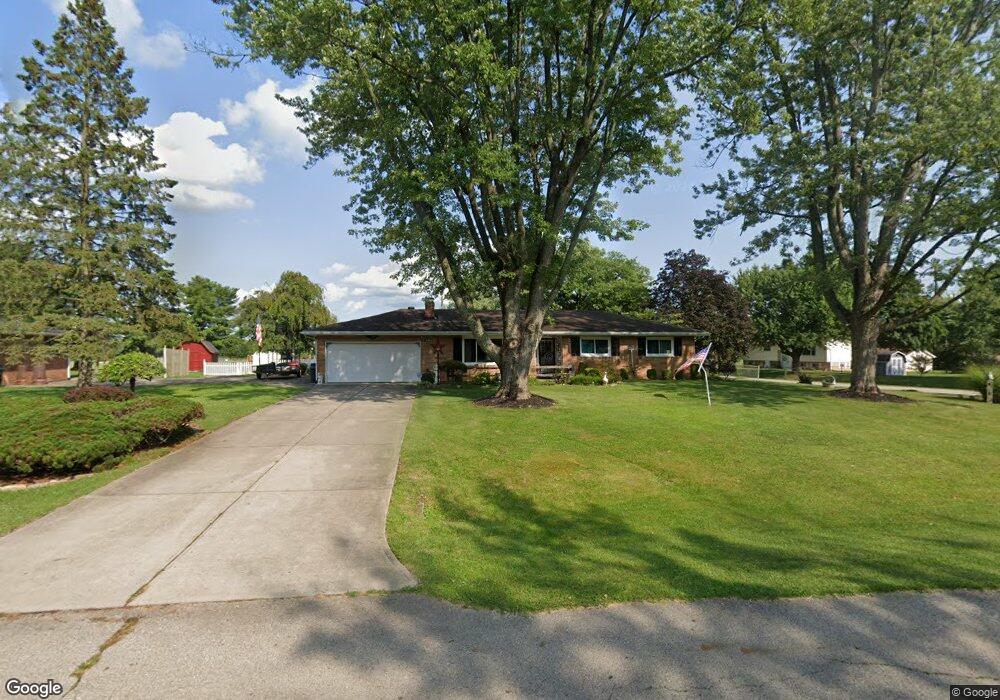
3244 Bechtel Dr Franklin, OH 45005
Estimated Value: $293,000 - $307,000
3
Beds
2
Baths
1,776
Sq Ft
$170/Sq Ft
Est. Value
About This Home
This home is located at 3244 Bechtel Dr, Franklin, OH 45005 and is currently estimated at $302,499, approximately $170 per square foot. 3244 Bechtel Dr is a home located in Warren County with nearby schools including Franklin High School, Marshall High School, and Middletown Christian School.
Ownership History
Date
Name
Owned For
Owner Type
Purchase Details
Closed on
Feb 5, 2024
Sold by
Potter Kimberly R
Bought by
Potter Thomas K and Potter Kimberly R
Current Estimated Value
Purchase Details
Closed on
Nov 11, 2020
Sold by
Williams Timothy L and Williams Cynthia J
Bought by
Potter Kimberly R
Purchase Details
Closed on
Apr 15, 1987
Sold by
Geisler Geisler and Geisler Charles R
Bought by
Rose Rose and Rose Ronald R
Purchase Details
Closed on
Aug 7, 1984
Sold by
Norris Philip M and Norris Vikki
Bought by
Geisler and Geisler Charles R
Create a Home Valuation Report for This Property
The Home Valuation Report is an in-depth analysis detailing your home's value as well as a comparison with similar homes in the area
Home Values in the Area
Average Home Value in this Area
Purchase History
| Date | Buyer | Sale Price | Title Company |
|---|---|---|---|
| Potter Thomas K | -- | None Listed On Document | |
| Potter Kimberly R | -- | None Available | |
| Rose Rose | $64,000 | -- | |
| Geisler | $60,000 | -- |
Source: Public Records
Tax History
| Year | Tax Paid | Tax Assessment Tax Assessment Total Assessment is a certain percentage of the fair market value that is determined by local assessors to be the total taxable value of land and additions on the property. | Land | Improvement |
|---|---|---|---|---|
| 2025 | $3,692 | $83,880 | $19,570 | $64,310 |
| 2024 | $3,692 | $83,880 | $19,570 | $64,310 |
| 2023 | $3,332 | $68,155 | $16,047 | $52,108 |
| 2022 | $3,259 | $68,156 | $16,048 | $52,108 |
| 2021 | $3,077 | $68,156 | $16,048 | $52,108 |
| 2020 | $2,397 | $55,412 | $13,048 | $42,364 |
| 2019 | $2,164 | $55,412 | $13,048 | $42,364 |
| 2018 | $2,157 | $55,412 | $13,048 | $42,364 |
| 2017 | $1,974 | $47,418 | $11,323 | $36,096 |
| 2016 | $2,016 | $47,418 | $11,323 | $36,096 |
| 2015 | $2,017 | $47,418 | $11,323 | $36,096 |
| 2014 | $1,955 | $45,160 | $10,780 | $34,380 |
| 2013 | $1,653 | $54,640 | $13,050 | $41,590 |
Source: Public Records
Map
Nearby Homes
- 4458 Rose Marie Rd
- 3412 State Route 122
- 3545 Robinson Vail Rd
- 3644 Connie Dr
- 4385 Harvest Ln
- 4689 Fisher Rd
- 4517 Renaissance Park Dr
- 5019 Betsy Dr
- 5100 Renaissance Park Dr
- 5139 Renaissance Park Dr
- 3833 Sterling Dr
- 3457 Madison Grace Way
- 5284 Othello Dr
- 3385 Madison Grace Way
- 5302 Othello Dr
- 4517 Renaissance Blvd Unit 263
- 5324 Donatello Dr
- 3095 Canvasback Ct
- 3071 Canvasback Ct
- 3077 Canvasback Ct
- 3266 Bechtel Dr
- 3204 Bechtel Dr
- 4241 Rogers Dr
- 3253 Bechtel Dr
- 3233 Bechtel Dr
- 3290 Bechtel Dr
- 3277 Bechtel Dr
- 3195 Bechtel Dr
- 3170 Bechtel Dr
- 3299 Bechtel Dr
- 4246 Marvel Dr
- 4230 Marvel Dr
- 3185 Bechtel Dr
- 3321 Bechtel Dr
- 3146 Bechtel Dr
- 4212 Marvel Dr
- 3159 Bechtel Dr
- 4192 Marvel Dr
- 3341 Bechtel Dr
- 3234 Jeffery Dr
Your Personal Tour Guide
Ask me questions while you tour the home.